

SMC Trading point update
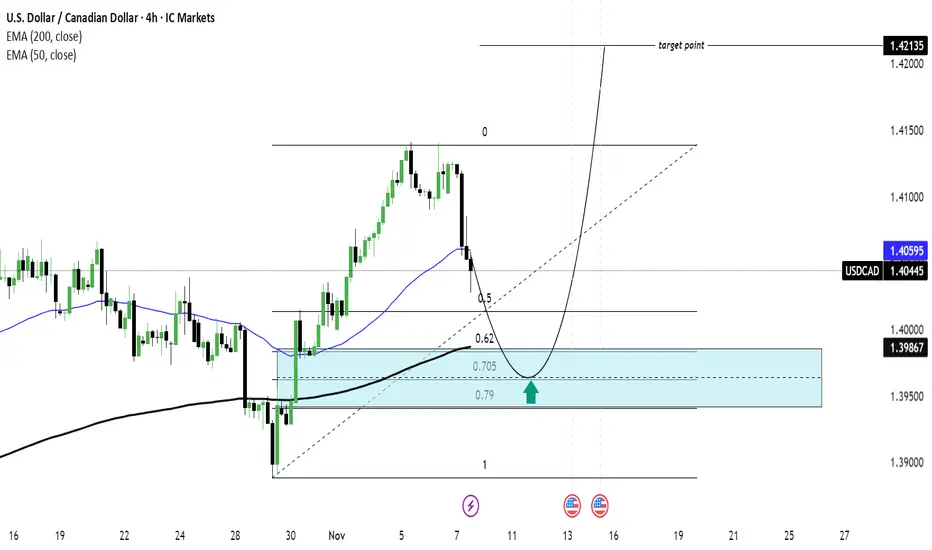
Technical analysis of USD/CAD 4-hour timeframe, based on Smart Money Concepts (SMC) and Fibonacci retracement confluences.
Here’s a full breakdown of the idea behind this analysis:
---
Overall Bias: Bullish Continuation
The chart suggests that USD/CAD is in an uptrend, currently undergoing a corrective pullback into a key discount zone (buy area) before potentially continuing higher toward the next liquidity target.
---
Technical Breakdown
1. Trend Context
The pair recently broke structure to the upside, indicating a bullish shift in market structure (MSB).
Price has been forming higher highs and higher lows, confirming bullish order flow.
The 50 EMA (blue) and 200 EMA (black) are aligned in bullish order — 50 EMA above 200 EMA — signaling overall bullish momentum.
2. Retracement / Discount Zone
Price is currently pulling back after a bullish impulse.
The blue box zone represents a discount buy zone between 0.62–0.79 Fibonacci retracement levels.
The green arrow marks the expected reversal area, showing potential demand and liquidity accumulation before continuation.
Confluence:
200 EMA support
0.62–0.79 Fibonacci zone
Prior structure / demand zone
3. Projected Price Path
The price is expected to:
1. Dip into the discount zone (1.3980–1.3950 area).
2. Find bullish rejection / confirmation from that zone.
3. Reverse upward, targeting 1.42135 (the next liquidity / target point).
4. Target Point
The target at 1.42135 aligns with:
Prior swing high (liquidity zone).
Fibonacci extension completion.
Potential imbalance fill.
---
Market Structure Summary
Element Direction Key Levels
Market Bias Bullish
Demand Zone (Buy Area) 1.3980 – 1.3950 0.62–0.79 fib confluence
Support Confluence 200 EMA + Demand Zone
Entry Zone Bullish reaction from blue zone
Target 1.4213 Liquidity target
---
Trade Idea (Conceptually)
Wait for price to reach the blue demand zone and show a bullish confirmation candle or structure shift.
Then consider a long entry with:
Entry: Around 1.3980–1.3960
Stop-loss: Below 1.3930 (beneath zone)
Take-profit: Around 1.4213
Mr SMC Trading point
---
Narrative Summary
> This setup expects a bullish continuation following a corrective retracement into a high-probability demand area. The confluence of Fibonacci discount levels, EMAs, and structure support strengthens the case for buyers to rejoin the trend, targeting liquidity above 1.4213.
---
Please support boost 🚀 this analysis
Technical analysis of USD/CAD 4-hour timeframe, based on Smart Money Concepts (SMC) and Fibonacci retracement confluences.
Here’s a full breakdown of the idea behind this analysis:
---
Overall Bias: Bullish Continuation
The chart suggests that USD/CAD is in an uptrend, currently undergoing a corrective pullback into a key discount zone (buy area) before potentially continuing higher toward the next liquidity target.
---
Technical Breakdown
1. Trend Context
The pair recently broke structure to the upside, indicating a bullish shift in market structure (MSB).
Price has been forming higher highs and higher lows, confirming bullish order flow.
The 50 EMA (blue) and 200 EMA (black) are aligned in bullish order — 50 EMA above 200 EMA — signaling overall bullish momentum.
2. Retracement / Discount Zone
Price is currently pulling back after a bullish impulse.
The blue box zone represents a discount buy zone between 0.62–0.79 Fibonacci retracement levels.
The green arrow marks the expected reversal area, showing potential demand and liquidity accumulation before continuation.
Confluence:
200 EMA support
0.62–0.79 Fibonacci zone
Prior structure / demand zone
3. Projected Price Path
The price is expected to:
1. Dip into the discount zone (1.3980–1.3950 area).
2. Find bullish rejection / confirmation from that zone.
3. Reverse upward, targeting 1.42135 (the next liquidity / target point).
4. Target Point
The target at 1.42135 aligns with:
Prior swing high (liquidity zone).
Fibonacci extension completion.
Potential imbalance fill.
---
Market Structure Summary
Element Direction Key Levels
Market Bias Bullish
Demand Zone (Buy Area) 1.3980 – 1.3950 0.62–0.79 fib confluence
Support Confluence 200 EMA + Demand Zone
Entry Zone Bullish reaction from blue zone
Target 1.4213 Liquidity target
---
Trade Idea (Conceptually)
Wait for price to reach the blue demand zone and show a bullish confirmation candle or structure shift.
Then consider a long entry with:
Entry: Around 1.3980–1.3960
Stop-loss: Below 1.3930 (beneath zone)
Take-profit: Around 1.4213
Mr SMC Trading point
---
Narrative Summary
> This setup expects a bullish continuation following a corrective retracement into a high-probability demand area. The confluence of Fibonacci discount levels, EMAs, and structure support strengthens the case for buyers to rejoin the trend, targeting liquidity above 1.4213.
---
Please support boost 🚀 this analysis
Trade ist aktiv

(Services:✔️ JOIN Telegram channel
t.me/+zmgnHqUTiY8wMTU0
t.me/+zmgnHqUTiY8wMTU0
t.me/+zmgnHqUTiY8wMTU0
Join my recommended broker , link 👇
World best broker exness ✅D
one.exnesstrack.org/a/l1t1rf3p6v
t.me/+zmgnHqUTiY8wMTU0
t.me/+zmgnHqUTiY8wMTU0
t.me/+zmgnHqUTiY8wMTU0
Join my recommended broker , link 👇
World best broker exness ✅D
one.exnesstrack.org/a/l1t1rf3p6v
Haftungsausschluss
Die Informationen und Veröffentlichungen sind nicht als Finanz-, Anlage-, Handels- oder andere Arten von Ratschlägen oder Empfehlungen gedacht, die von TradingView bereitgestellt oder gebilligt werden, und stellen diese nicht dar. Lesen Sie mehr in den Nutzungsbedingungen.
(Services:✔️ JOIN Telegram channel
t.me/+zmgnHqUTiY8wMTU0
t.me/+zmgnHqUTiY8wMTU0
t.me/+zmgnHqUTiY8wMTU0
Join my recommended broker , link 👇
World best broker exness ✅D
one.exnesstrack.org/a/l1t1rf3p6v
t.me/+zmgnHqUTiY8wMTU0
t.me/+zmgnHqUTiY8wMTU0
t.me/+zmgnHqUTiY8wMTU0
Join my recommended broker , link 👇
World best broker exness ✅D
one.exnesstrack.org/a/l1t1rf3p6v
Haftungsausschluss
Die Informationen und Veröffentlichungen sind nicht als Finanz-, Anlage-, Handels- oder andere Arten von Ratschlägen oder Empfehlungen gedacht, die von TradingView bereitgestellt oder gebilligt werden, und stellen diese nicht dar. Lesen Sie mehr in den Nutzungsbedingungen.