

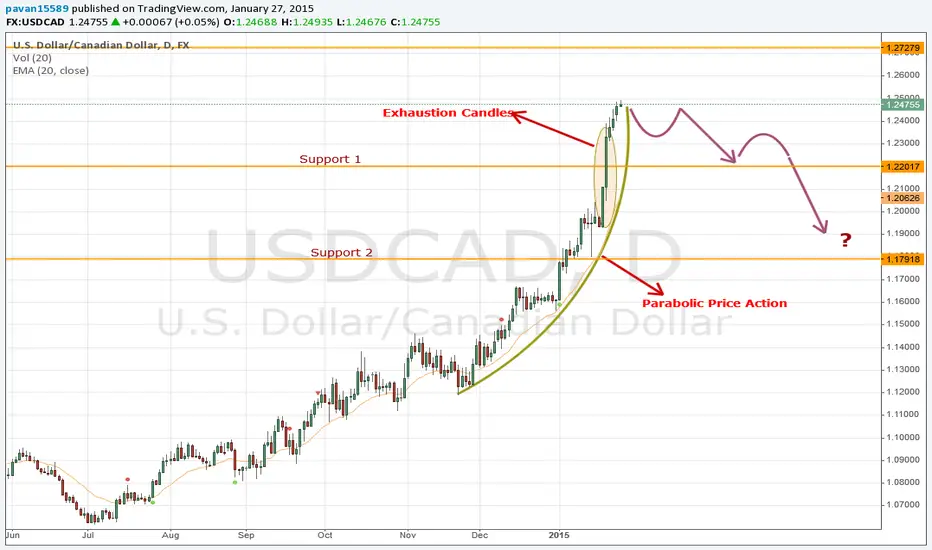
USDCAD has had a long rally which started back in June last year. After nearly 3 quarters of run up the hill, the price action shows signs of an evident reversal.
How can reversal be expected at the highs ?
Studying the price action, we could see that the pair has had a very consistent uptrend for a long time with consistent pull backs and trend resumption but the recent candles from the week before on the daily have two large candles which are significantly larger than any candles prior to them. We can also observe that the candles following these two large candles are extremely weaker. With all this, we could see a parabolic price action formation which always indicates an exhaustion and a short term reversal.
What to expect ?
Expect the price to pull back and make a lower high or a double top before falling further back down to support.

Haftungsausschluss
Die Informationen und Veröffentlichungen sind nicht als Finanz-, Anlage-, Handels- oder andere Arten von Ratschlägen oder Empfehlungen gedacht, die von TradingView bereitgestellt oder gebilligt werden, und stellen diese nicht dar. Lesen Sie mehr in den Nutzungsbedingungen.
Haftungsausschluss
Die Informationen und Veröffentlichungen sind nicht als Finanz-, Anlage-, Handels- oder andere Arten von Ratschlägen oder Empfehlungen gedacht, die von TradingView bereitgestellt oder gebilligt werden, und stellen diese nicht dar. Lesen Sie mehr in den Nutzungsbedingungen.