

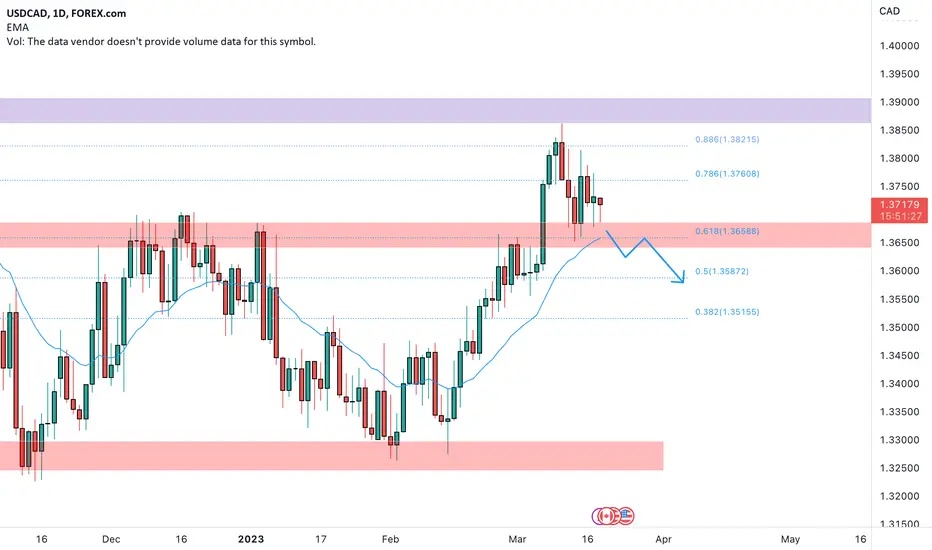
USDCAD on the 1D chart has traded at the recent high.
The price after testing the weekly support at the 1.33 level started an impulse that drive the pair to a new test of the monthly resistance with a spike.
We can notice how the market turned at the 0.886 Fibonacci retracement from the previous recent high to the 1.33 level.
How can i approach this scenario?
I will wait for a potential break of the support area and IF that will happen i will move on the 4h chart to look for a possible short order according to the Plancton's strategy rules.
The price after testing the weekly support at the 1.33 level started an impulse that drive the pair to a new test of the monthly resistance with a spike.
We can notice how the market turned at the 0.886 Fibonacci retracement from the previous recent high to the 1.33 level.
How can i approach this scenario?
I will wait for a potential break of the support area and IF that will happen i will move on the 4h chart to look for a possible short order according to the Plancton's strategy rules.
Anmerkung
Anmerkung
Anmerkung
Anmerkung
Anmerkung
Anmerkung
Anmerkung
Anmerkung

Haftungsausschluss
Die Informationen und Veröffentlichungen sind nicht als Finanz-, Anlage-, Handels- oder andere Arten von Ratschlägen oder Empfehlungen gedacht, die von TradingView bereitgestellt oder gebilligt werden, und stellen diese nicht dar. Lesen Sie mehr in den Nutzungsbedingungen.
Haftungsausschluss
Die Informationen und Veröffentlichungen sind nicht als Finanz-, Anlage-, Handels- oder andere Arten von Ratschlägen oder Empfehlungen gedacht, die von TradingView bereitgestellt oder gebilligt werden, und stellen diese nicht dar. Lesen Sie mehr in den Nutzungsbedingungen.