


Analysis –
USDCAD | W1 | BULLISH
This is a potential 175+ pip setup.
Our analysis has been produced from the Trend Based Fibonacci.
The methodology has been reciprocated with price action since April 2016.
The price has now reached our 78.6% retracement .
The weekly candlestick has closed above this level which exhibits a rejection.
This analysis also offers confluence in terms of a positive correlation coefficient to neighbouring USD pairs.
Therefore, we foresee bullish momentum with a potential re-test at the supply / distribution zone; at the 1.332XX key level.
After this level has been tested we shall expect price to reverse forming an Elliot Wave downtrend.
Please note this is not financial advise.
Thank you.
USDCAD | W1 | BULLISH
This is a potential 175+ pip setup.
Our analysis has been produced from the Trend Based Fibonacci.
The methodology has been reciprocated with price action since April 2016.
The price has now reached our 78.6% retracement .
The weekly candlestick has closed above this level which exhibits a rejection.
This analysis also offers confluence in terms of a positive correlation coefficient to neighbouring USD pairs.
Therefore, we foresee bullish momentum with a potential re-test at the supply / distribution zone; at the 1.332XX key level.
After this level has been tested we shall expect price to reverse forming an Elliot Wave downtrend.
Please note this is not financial advise.
Thank you.
Trade geschlossen: Ziel wurde erreicht
Part two —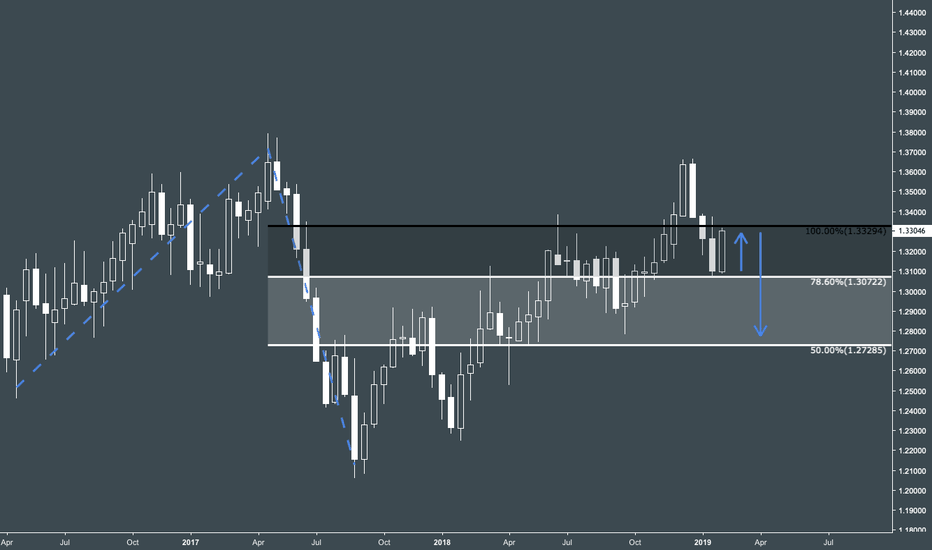
A total 175 pips reached so far!

Haftungsausschluss
Die Informationen und Veröffentlichungen sind nicht als Finanz-, Anlage-, Handels- oder andere Arten von Ratschlägen oder Empfehlungen gedacht, die von TradingView bereitgestellt oder gebilligt werden, und stellen diese nicht dar. Lesen Sie mehr in den Nutzungsbedingungen.
Haftungsausschluss
Die Informationen und Veröffentlichungen sind nicht als Finanz-, Anlage-, Handels- oder andere Arten von Ratschlägen oder Empfehlungen gedacht, die von TradingView bereitgestellt oder gebilligt werden, und stellen diese nicht dar. Lesen Sie mehr in den Nutzungsbedingungen.