

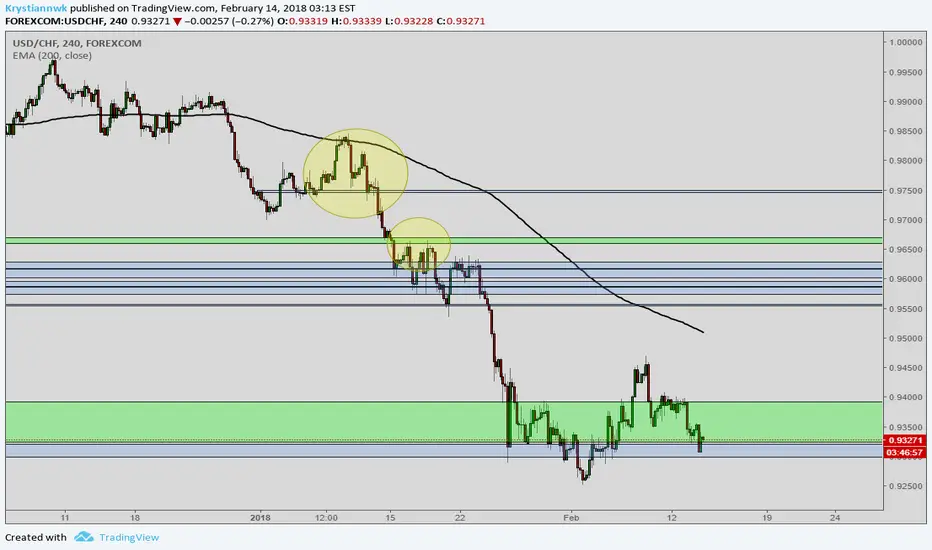
Blue stripes representing GAP on daily chart
Green stripes are representing GAP on weekly chart
Circle in the left upper corner we can see irregular H&S formation plus 200 ema rejection
Another circle in the left upper corner is the place where pair has very hard time to go above weekly GAP and after rejection going south
right now pair is trading in weekly GAP it formed H&S formation but to me it is not strong signal enough as it may go higher very quickly
I'll wait patiently and see what will happen
Green stripes are representing GAP on weekly chart
Circle in the left upper corner we can see irregular H&S formation plus 200 ema rejection
Another circle in the left upper corner is the place where pair has very hard time to go above weekly GAP and after rejection going south
right now pair is trading in weekly GAP it formed H&S formation but to me it is not strong signal enough as it may go higher very quickly
I'll wait patiently and see what will happen

Haftungsausschluss
Die Informationen und Veröffentlichungen sind nicht als Finanz-, Anlage-, Handels- oder andere Arten von Ratschlägen oder Empfehlungen gedacht, die von TradingView bereitgestellt oder gebilligt werden, und stellen diese nicht dar. Lesen Sie mehr in den Nutzungsbedingungen.
Haftungsausschluss
Die Informationen und Veröffentlichungen sind nicht als Finanz-, Anlage-, Handels- oder andere Arten von Ratschlägen oder Empfehlungen gedacht, die von TradingView bereitgestellt oder gebilligt werden, und stellen diese nicht dar. Lesen Sie mehr in den Nutzungsbedingungen.