

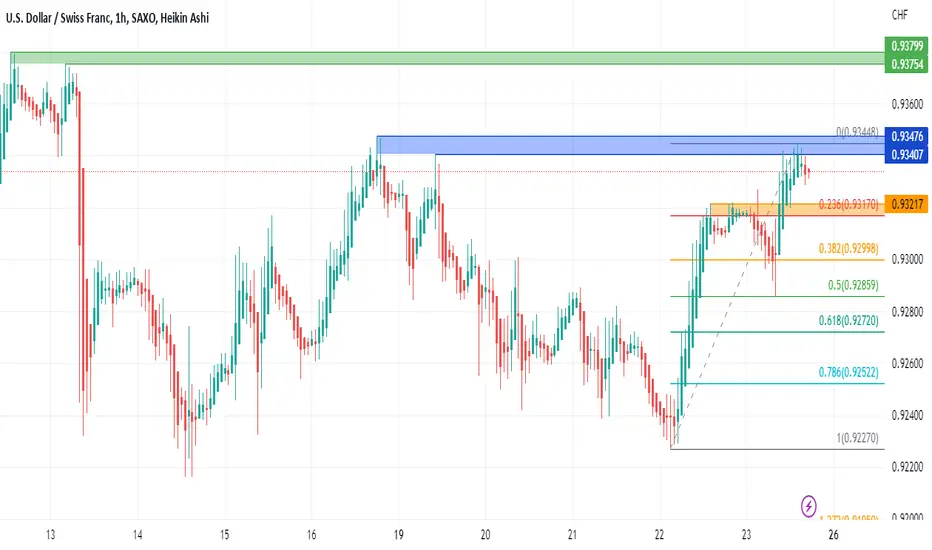
USDCHF has repeatedly failed to break above the resistance area of 0.93407-0.93476 on the hourly chart.
Now, Heikin Ashi chart indicates a beginning of a trend reversal. So, the levels of 0.93217-0.93170 and 0.92998 are the next targets of the USDCHF pullback move.
On the flip side, a breakout above the blue shaded area may invalidate the pervious hypothesis and will target the levels of 0.93754-0.93799 then.
(Support & resistance and Fibonacci levels are based on the candlestick chart.)
Now, Heikin Ashi chart indicates a beginning of a trend reversal. So, the levels of 0.93217-0.93170 and 0.92998 are the next targets of the USDCHF pullback move.
On the flip side, a breakout above the blue shaded area may invalidate the pervious hypothesis and will target the levels of 0.93754-0.93799 then.
(Support & resistance and Fibonacci levels are based on the candlestick chart.)
Trade geschlossen: Ziel wurde erreicht

Haftungsausschluss
Die Informationen und Veröffentlichungen sind nicht als Finanz-, Anlage-, Handels- oder andere Arten von Ratschlägen oder Empfehlungen gedacht, die von TradingView bereitgestellt oder gebilligt werden, und stellen diese nicht dar. Lesen Sie mehr in den Nutzungsbedingungen.
Haftungsausschluss
Die Informationen und Veröffentlichungen sind nicht als Finanz-, Anlage-, Handels- oder andere Arten von Ratschlägen oder Empfehlungen gedacht, die von TradingView bereitgestellt oder gebilligt werden, und stellen diese nicht dar. Lesen Sie mehr in den Nutzungsbedingungen.