

USDJPY Weekly Chart. On the way to test the high from July??
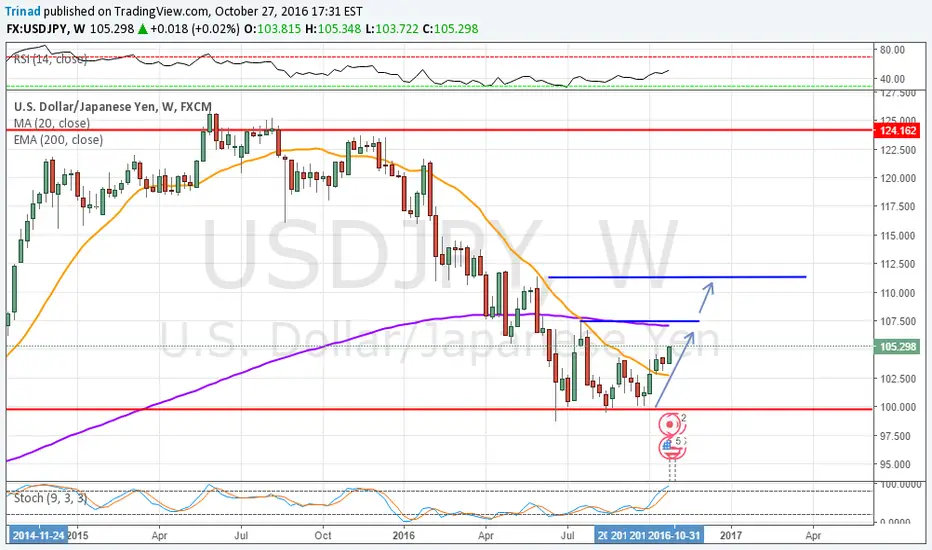
Looks to me like the USDJPY pair is on the way to test the high from July 2016 at 107.50
Around that level is the EMA200 which will be a resistance.
If the Bulls' have collect enough strength to break trough and close over the EMA200 and the High from July 2016, i will expect a bullish movement towards 111.00
Around that level is the EMA200 which will be a resistance.
If the Bulls' have collect enough strength to break trough and close over the EMA200 and the High from July 2016, i will expect a bullish movement towards 111.00
Anmerkung
Anmerkung
Trade ist aktiv
Trade ist aktiv

Haftungsausschluss
Die Informationen und Veröffentlichungen sind nicht als Finanz-, Anlage-, Handels- oder andere Arten von Ratschlägen oder Empfehlungen gedacht, die von TradingView bereitgestellt oder gebilligt werden, und stellen diese nicht dar. Lesen Sie mehr in den Nutzungsbedingungen.
Haftungsausschluss
Die Informationen und Veröffentlichungen sind nicht als Finanz-, Anlage-, Handels- oder andere Arten von Ratschlägen oder Empfehlungen gedacht, die von TradingView bereitgestellt oder gebilligt werden, und stellen diese nicht dar. Lesen Sie mehr in den Nutzungsbedingungen.