

Technical Analysis
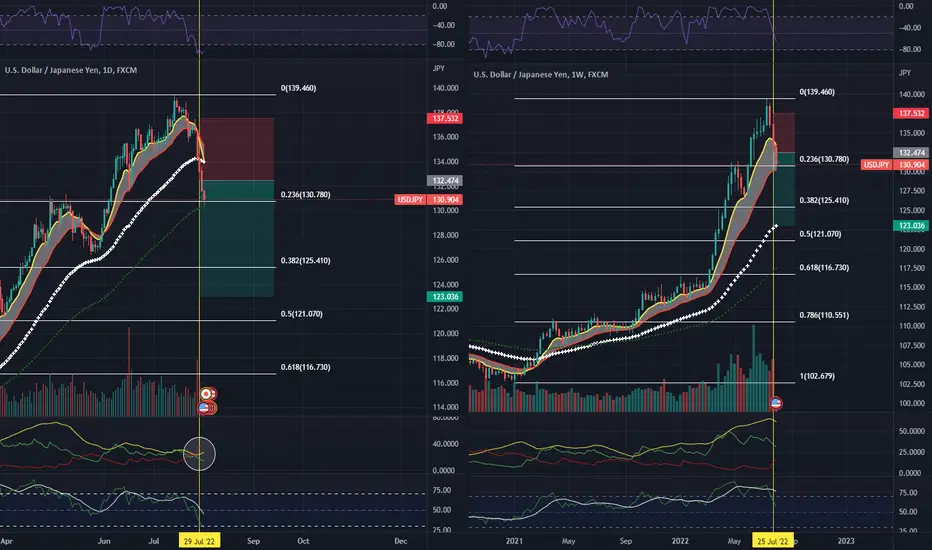
Weekly chart is overbought with RSI above the 75 zone and finally breaking below.
Daily DMI and MA crossover signaling a reversal play from 132 to 122 if it breaks the 130 area within the next week or two.
Weekly chart is overbought with RSI above the 75 zone and finally breaking below.
Daily DMI and MA crossover signaling a reversal play from 132 to 122 if it breaks the 130 area within the next week or two.
Trade ist aktiv
Anmerkung
I expect some support at the fib 0.23 level before a further push downward as EMA's follow and create lower resistance levels.Anmerkung
Technical AnalysisPrice has found some support on the 1D 100EMA/ Weekly 20EMA and bounced off for a push upwards. We might expect a move up as high as 134 before it find resistance and we see a continuations.
The EMA support also coincides with Fib level 0.23.
The push upwards is due to RSI and William %R on the 1D being at low levels. However, we still see a downward potential on the Weekly William %R and RSI and the ADX needs to reset to the median
Anmerkung
We need resistance at 134.50-135.2 for the Short reversal to be confirmed. If it breaks the 135.20 level we are back on a Long continuation.
— subtlepapi
Haftungsausschluss
Die Informationen und Veröffentlichungen sind nicht als Finanz-, Anlage-, Handels- oder andere Arten von Ratschlägen oder Empfehlungen gedacht, die von TradingView bereitgestellt oder gebilligt werden, und stellen diese nicht dar. Lesen Sie mehr in den Nutzungsbedingungen.
— subtlepapi
Haftungsausschluss
Die Informationen und Veröffentlichungen sind nicht als Finanz-, Anlage-, Handels- oder andere Arten von Ratschlägen oder Empfehlungen gedacht, die von TradingView bereitgestellt oder gebilligt werden, und stellen diese nicht dar. Lesen Sie mehr in den Nutzungsbedingungen.