

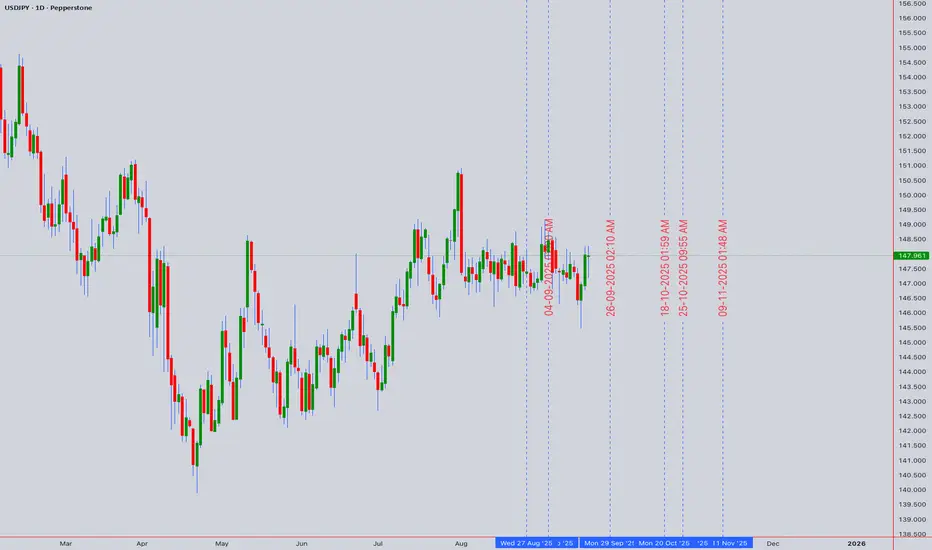
📊 USDJPY Forecast 🔮💹 (147.961) Closing 20th Sept 2025 | 12:50 AM UTC+4
🕵️♂️ Market Snapshot
USDJPY closed at 147.961, showing mixed signals as bulls attempt to hold ground near critical levels while sellers eye a potential reversal. ⚖️
🏦 Technical Framework
🔹 Chart Patterns
🔹 Indicators
🕐 Intraday Outlook
Take Profit 🎯:
Stop Loss 🛑:
⏳ Swing Trading Outlook
📌 Key Levels
🎯 Strategy Summary
✅ Intraday: Buy dips near support, sell rallies near resistance.
✅ Swing: Watch 149.20 breakout or 146.80 breakdown for larger moves.
⚡ Volatility expected → trade with strict risk control.
🌍 Market Context
🔥 Trade Smart | Manage Risk | Respect Levels 🔥
For individuals seeking to enhance their trading abilities based on the analyses provided, I recommend exploring the mentoring program offered by Shunya Trade. (Website: shunya dot trade)
I would appreciate your feedback on this analysis, as it will serve as a valuable resource for future endeavors.
Sincerely,
Shunya.Trade
Website: shunya dot trade
⚠️Disclaimer: This post is intended solely for educational purposes and does not constitute investment advice, financial advice, or trading recommendations. The views expressed herein are derived from technical analysis and are shared for informational purposes only. The stock market inherently carries risks, including the potential for capital loss. Therefore, readers are strongly advised to exercise prudent judgment before making any investment decisions. We assume no liability for any actions taken based on this content. For personalized guidance, it is recommended to consult a certified financial advisor.
🕵️♂️ Market Snapshot
USDJPY closed at 147.961, showing mixed signals as bulls attempt to hold ground near critical levels while sellers eye a potential reversal. ⚖️
🏦 Technical Framework
🔹 Chart Patterns
📈 Possible Elliott Wave 5th leg exhaustion near 148.5–149.2.
🌀 Harmonic PRZ forming around 149.0.
🏯 Ichimoku Cloud shows resistance overhead, baseline support at 147.3.
⚠️ Watch for bull trap if price fails 148.2.
🔹 Indicators
RSI 📊: 62 → mild overbought.
BB 🔔: Price hugging upper band = volatility spike.
MA Cross 🔀: Golden cross intact, but momentum flattening.
VWAP ⚡: Anchored VWAP = 147.6 → strong pivot.
🕐 Intraday Outlook
- Buy Zone 💵: 147.40 – 147.60 (support + VWAP confluence).
- Sell Zone 💸: 148.50 – 148.80 (resistance + harmonic).
Take Profit 🎯:
- Longs → 148.20 / 148.50
- Shorts → 147.10 / 146.80
Stop Loss 🛑:
- Longs < 147.20
- Shorts > 149.00
⏳ Swing Trading Outlook
Bullish Scenario 🐂: Break & close above 149.20 → next target 150.50 – 151.20.
Bearish Scenario 🐻: Close below 146.80 → correction toward 145.40 – 144.70.
📌 Key Levels
Resistance: 148.20 / 148.80 / 149.20
Support: 147.40 / 146.80 / 145.40
🎯 Strategy Summary
✅ Intraday: Buy dips near support, sell rallies near resistance.
✅ Swing: Watch 149.20 breakout or 146.80 breakdown for larger moves.
⚡ Volatility expected → trade with strict risk control.
🌍 Market Context
Fed & BoJ policy divergence remains key.
Geopolitical jitters in Asia could trigger safe-haven flows → boosting JPY demand.
🔥 Trade Smart | Manage Risk | Respect Levels 🔥
For individuals seeking to enhance their trading abilities based on the analyses provided, I recommend exploring the mentoring program offered by Shunya Trade. (Website: shunya dot trade)
I would appreciate your feedback on this analysis, as it will serve as a valuable resource for future endeavors.
Sincerely,
Shunya.Trade
Website: shunya dot trade
⚠️Disclaimer: This post is intended solely for educational purposes and does not constitute investment advice, financial advice, or trading recommendations. The views expressed herein are derived from technical analysis and are shared for informational purposes only. The stock market inherently carries risks, including the potential for capital loss. Therefore, readers are strongly advised to exercise prudent judgment before making any investment decisions. We assume no liability for any actions taken based on this content. For personalized guidance, it is recommended to consult a certified financial advisor.

I am nothing @shunya.trade
Haftungsausschluss
Die Informationen und Veröffentlichungen sind nicht als Finanz-, Anlage-, Handels- oder andere Arten von Ratschlägen oder Empfehlungen gedacht, die von TradingView bereitgestellt oder gebilligt werden, und stellen diese nicht dar. Lesen Sie mehr in den Nutzungsbedingungen.
I am nothing @shunya.trade
Haftungsausschluss
Die Informationen und Veröffentlichungen sind nicht als Finanz-, Anlage-, Handels- oder andere Arten von Ratschlägen oder Empfehlungen gedacht, die von TradingView bereitgestellt oder gebilligt werden, und stellen diese nicht dar. Lesen Sie mehr in den Nutzungsbedingungen.