

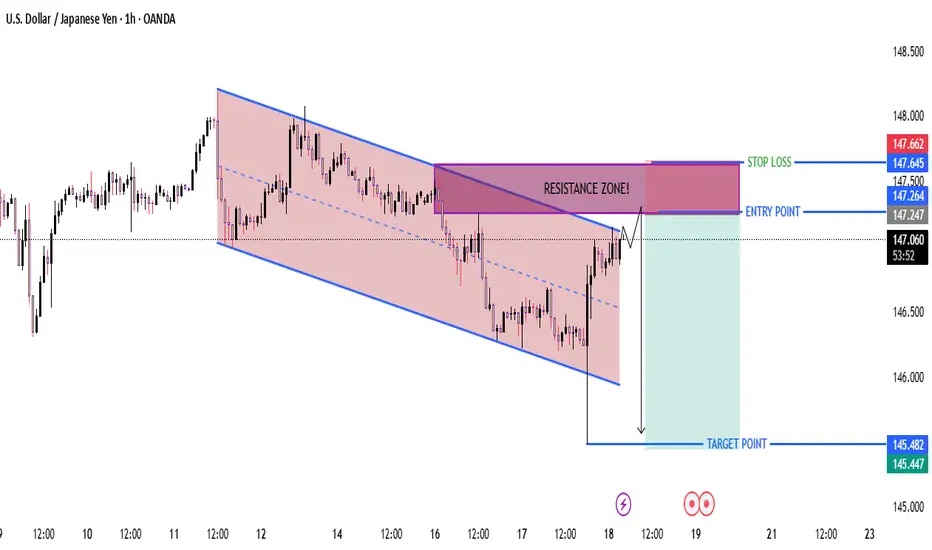
USD/JPY (1-hour timeframe)
Chart Setup
Trend: The price has been moving in a downward channel (highlighted in red).
Current Position: Price has recently bounced up from the lower boundary of the channel and is approaching the resistance zone (purple box).
Resistance Zone: ~147.247 – 147.645
Planned Entry Point: 147.264
Stop Loss: 147.662 (above resistance)
Target Point: 145.482
Trading Idea
This is a short (sell) setup.
The idea is to wait for price to reach resistance (around 147.247–147.500) and then enter a short position.
Expectation: Price will get rejected from resistance and move back down toward the target (145.482).
Risk/Reward
Risk: ~40 pips (147.264 → 147.662)
Reward: ~178 pips (147.264 → 145.482)
Risk-to-Reward Ratio (RRR): ~1:4.4 → very favorable setup.
Key Notes
✅ Strong risk-to-reward setup.
✅ Trade follows the dominant downtrend (channel).
⚠️ If price breaks and closes above 147.662, setup is invalid (trend may shift bullish).
⚠️ Best to wait for bearish candlestick confirmation in resistance zone before entry.
🔎 In short: This chart suggests a sell trade setup at resistance with a clear stop loss and a large potential downside profit target.
Chart Setup
Trend: The price has been moving in a downward channel (highlighted in red).
Current Position: Price has recently bounced up from the lower boundary of the channel and is approaching the resistance zone (purple box).
Resistance Zone: ~147.247 – 147.645
Planned Entry Point: 147.264
Stop Loss: 147.662 (above resistance)
Target Point: 145.482
Trading Idea
This is a short (sell) setup.
The idea is to wait for price to reach resistance (around 147.247–147.500) and then enter a short position.
Expectation: Price will get rejected from resistance and move back down toward the target (145.482).
Risk/Reward
Risk: ~40 pips (147.264 → 147.662)
Reward: ~178 pips (147.264 → 145.482)
Risk-to-Reward Ratio (RRR): ~1:4.4 → very favorable setup.
Key Notes
✅ Strong risk-to-reward setup.
✅ Trade follows the dominant downtrend (channel).
⚠️ If price breaks and closes above 147.662, setup is invalid (trend may shift bullish).
⚠️ Best to wait for bearish candlestick confirmation in resistance zone before entry.
🔎 In short: This chart suggests a sell trade setup at resistance with a clear stop loss and a large potential downside profit target.

join my telegram channel t.me/smartforexacademy45 t.me/smartforexacademy45
JOIN MY REFREL BROKER LINK one.exnessonelink.com/a/gissbq1h9c?source=app
JOIN MY REFREL BROKER LINK one.exnessonelink.com/a/gissbq1h9c?source=app
Haftungsausschluss
Die Informationen und Veröffentlichungen sind nicht als Finanz-, Anlage-, Handels- oder andere Arten von Ratschlägen oder Empfehlungen gedacht, die von TradingView bereitgestellt oder gebilligt werden, und stellen diese nicht dar. Lesen Sie mehr in den Nutzungsbedingungen.
join my telegram channel t.me/smartforexacademy45 t.me/smartforexacademy45
JOIN MY REFREL BROKER LINK one.exnessonelink.com/a/gissbq1h9c?source=app
JOIN MY REFREL BROKER LINK one.exnessonelink.com/a/gissbq1h9c?source=app
Haftungsausschluss
Die Informationen und Veröffentlichungen sind nicht als Finanz-, Anlage-, Handels- oder andere Arten von Ratschlägen oder Empfehlungen gedacht, die von TradingView bereitgestellt oder gebilligt werden, und stellen diese nicht dar. Lesen Sie mehr in den Nutzungsbedingungen.