

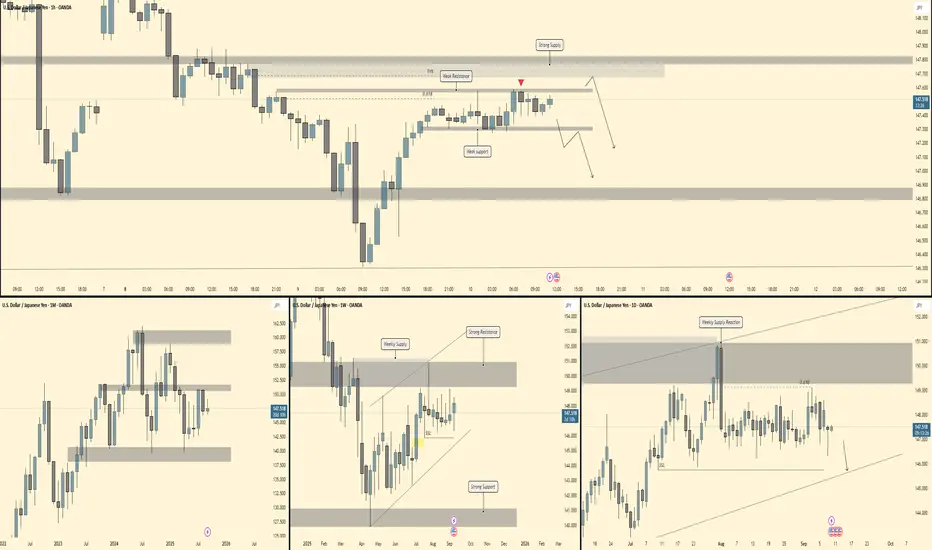
🟣 Monthly Chart (Macro Structure)
Context: Price has been ranging within a broad band between 162 resistance and 138–140 support.
Current Zone: Sitting mid-range near 147–148, right under a heavy monthly supply block (150–152).
Bias: Until 150+ breaks clean, upside is capped. Structure suggests more downside liquidity hunts.
🔵 Weekly Chart (Swing Bias)
Supply Zone: Weekly supply at 150–152 rejected strongly.
Trendline: Rising liquidity channel (higher lows), but capped at supply.
Order Flow: Repeated rejections indicate sellers still control the higher timeframe.
Bias: Bearish toward the liquidity resting around 145.
Key Levels:
Resistance: 150–152
Support: 144–145
🟢 Daily Chart (Refined Structure)
Supply Reaction: Strong rejection from the 61.8% retrace within the weekly supply zone.
SSL (Sell-Side Liquidity): Resting neatly at 145 handle, aligning with trendline support.
Bias: Lower-high structure under supply → daily order flow favors continuation down.
⏱ 1H Chart (Execution Layer)
Supply Zone: 147.7–147.9 (confluent with 71% fib retrace & weak resistance).
Reaction: Intraday rejection already showing weakness.
Next Path: Break of weak support at 147.0 would confirm continuation toward 146.8 → 145.5.
Intraday Bias: Sell rallies back into 147.7–147.9.
Context: Price has been ranging within a broad band between 162 resistance and 138–140 support.
Current Zone: Sitting mid-range near 147–148, right under a heavy monthly supply block (150–152).
Bias: Until 150+ breaks clean, upside is capped. Structure suggests more downside liquidity hunts.
🔵 Weekly Chart (Swing Bias)
Supply Zone: Weekly supply at 150–152 rejected strongly.
Trendline: Rising liquidity channel (higher lows), but capped at supply.
Order Flow: Repeated rejections indicate sellers still control the higher timeframe.
Bias: Bearish toward the liquidity resting around 145.
Key Levels:
Resistance: 150–152
Support: 144–145
🟢 Daily Chart (Refined Structure)
Supply Reaction: Strong rejection from the 61.8% retrace within the weekly supply zone.
SSL (Sell-Side Liquidity): Resting neatly at 145 handle, aligning with trendline support.
Bias: Lower-high structure under supply → daily order flow favors continuation down.
⏱ 1H Chart (Execution Layer)
Supply Zone: 147.7–147.9 (confluent with 71% fib retrace & weak resistance).
Reaction: Intraday rejection already showing weakness.
Next Path: Break of weak support at 147.0 would confirm continuation toward 146.8 → 145.5.
Intraday Bias: Sell rallies back into 147.7–147.9.

Verbundene Veröffentlichungen
Haftungsausschluss
Die Informationen und Veröffentlichungen sind nicht als Finanz-, Anlage-, Handels- oder andere Arten von Ratschlägen oder Empfehlungen gedacht, die von TradingView bereitgestellt oder gebilligt werden, und stellen diese nicht dar. Lesen Sie mehr in den Nutzungsbedingungen.
Verbundene Veröffentlichungen
Haftungsausschluss
Die Informationen und Veröffentlichungen sind nicht als Finanz-, Anlage-, Handels- oder andere Arten von Ratschlägen oder Empfehlungen gedacht, die von TradingView bereitgestellt oder gebilligt werden, und stellen diese nicht dar. Lesen Sie mehr in den Nutzungsbedingungen.