

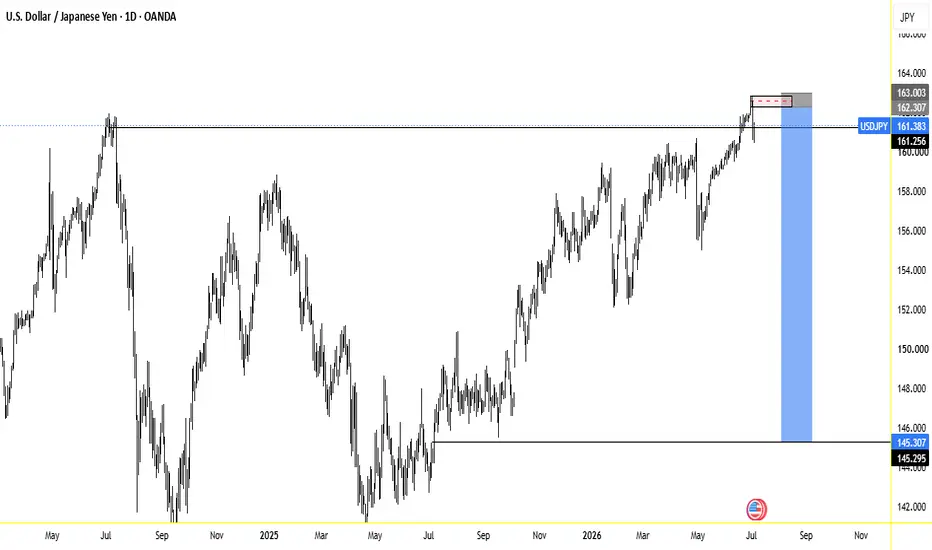
USDJPY recently made a new All-Time High, sweeping liquidity above the equal highs from the first week of July 2024.
The interesting part?
This move happened in the first week of July 2026, exactly two years later.
Price swept the equal lows liquidity, then closed below the entire ATH cluster with a strong institutional bearish candle, trapping late buyers.
Weekly Analysis
Liquidity sweep above prior highs
Strong reversal/funding candle closing below ATHs
Bearish Break of Structure (BOS) after liquidity grab
Daily Analysis
Clear Bearish Reversal Order Block formed (strong reversal pattern)
Significant Imbalance / Fair Value Gap left behind, likely to be filled
Price trading in Premium, targeting Discount zones
Trading PlanBias: Strongly Bearish
Watch 161.905 area for potential short opportunity
Looking for inducement into the zone followed by strong displacement lower
Confirmation on 4H/lower timeframes (CHOCH + OB mitigation)
Key Levels:
Resistance: 161.905 – 162.20
Invalidation: Daily close above 162.80–163.00
Targets: Imbalance fill → 155.00 → 145.295 (major liquidity pool)
This setup has excellent time symmetry, liquidity engineering, and higher timeframe structure alignment.
Waiting for market open to see how price reacts at 161.905.
Risk first.
What’s your view?
Reversal incoming or bullish continuation?
The interesting part?
This move happened in the first week of July 2026, exactly two years later.
Price swept the equal lows liquidity, then closed below the entire ATH cluster with a strong institutional bearish candle, trapping late buyers.
Weekly Analysis
Liquidity sweep above prior highs
Strong reversal/funding candle closing below ATHs
Bearish Break of Structure (BOS) after liquidity grab
Daily Analysis
Clear Bearish Reversal Order Block formed (strong reversal pattern)
Significant Imbalance / Fair Value Gap left behind, likely to be filled
Price trading in Premium, targeting Discount zones
Trading PlanBias: Strongly Bearish
Watch 161.905 area for potential short opportunity
Looking for inducement into the zone followed by strong displacement lower
Confirmation on 4H/lower timeframes (CHOCH + OB mitigation)
Key Levels:
Resistance: 161.905 – 162.20
Invalidation: Daily close above 162.80–163.00
Targets: Imbalance fill → 155.00 → 145.295 (major liquidity pool)
This setup has excellent time symmetry, liquidity engineering, and higher timeframe structure alignment.
Waiting for market open to see how price reacts at 161.905.
Risk first.
What’s your view?
Reversal incoming or bullish continuation?

Haftungsausschluss
Die Informationen und Veröffentlichungen sind nicht als Finanz-, Anlage-, Handels- oder andere Arten von Ratschlägen oder Empfehlungen gedacht, die von TradingView bereitgestellt oder gebilligt werden, und stellen diese nicht dar. Lesen Sie mehr in den Nutzungsbedingungen.
Haftungsausschluss
Die Informationen und Veröffentlichungen sind nicht als Finanz-, Anlage-, Handels- oder andere Arten von Ratschlägen oder Empfehlungen gedacht, die von TradingView bereitgestellt oder gebilligt werden, und stellen diese nicht dar. Lesen Sie mehr in den Nutzungsbedingungen.