

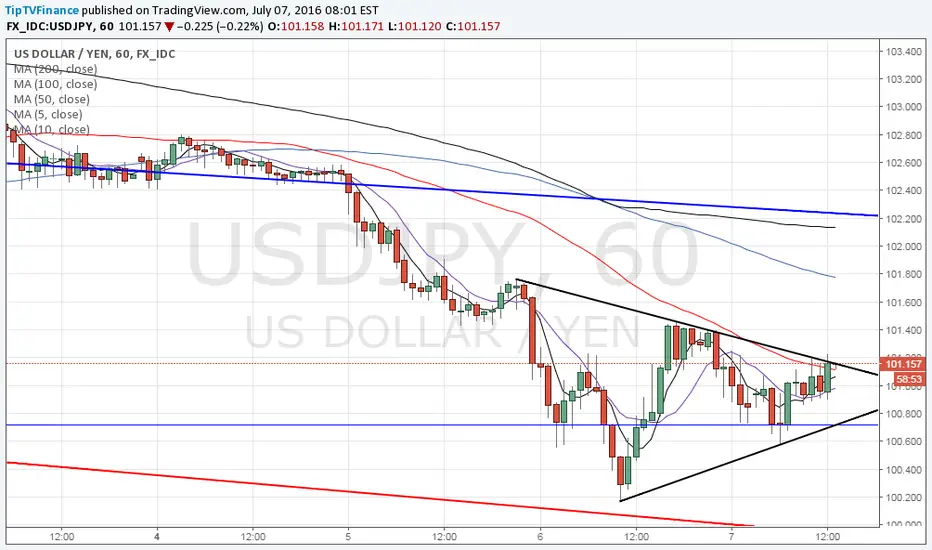
USD/JPY pair snapped back to 100+ levels as expected in the European session update.
Pair's rebound from 100.71 (50% of 2011 low-2015 high) if followed by a bullish break from the symmetrical triangle formation on the hourly chart would mean a temporary bottom is in place at 100.18 and open doors for a rise to 102.00 levels.
On the contrary, fresh weakness from the current rate of 101.20 if followed by a break below 100.71 on day end closing basis would be a signal that retreat from the post Brexit high of 103.20 has resumed and the pair could very well re-test 99.00 levels in the short-term.
Pair's rebound from 100.71 (50% of 2011 low-2015 high) if followed by a bullish break from the symmetrical triangle formation on the hourly chart would mean a temporary bottom is in place at 100.18 and open doors for a rise to 102.00 levels.
On the contrary, fresh weakness from the current rate of 101.20 if followed by a break below 100.71 on day end closing basis would be a signal that retreat from the post Brexit high of 103.20 has resumed and the pair could very well re-test 99.00 levels in the short-term.

Verbundene Veröffentlichungen
Haftungsausschluss
Die Informationen und Veröffentlichungen sind nicht als Finanz-, Anlage-, Handels- oder andere Arten von Ratschlägen oder Empfehlungen gedacht, die von TradingView bereitgestellt oder gebilligt werden, und stellen diese nicht dar. Lesen Sie mehr in den Nutzungsbedingungen.
Verbundene Veröffentlichungen
Haftungsausschluss
Die Informationen und Veröffentlichungen sind nicht als Finanz-, Anlage-, Handels- oder andere Arten von Ratschlägen oder Empfehlungen gedacht, die von TradingView bereitgestellt oder gebilligt werden, und stellen diese nicht dar. Lesen Sie mehr in den Nutzungsbedingungen.