

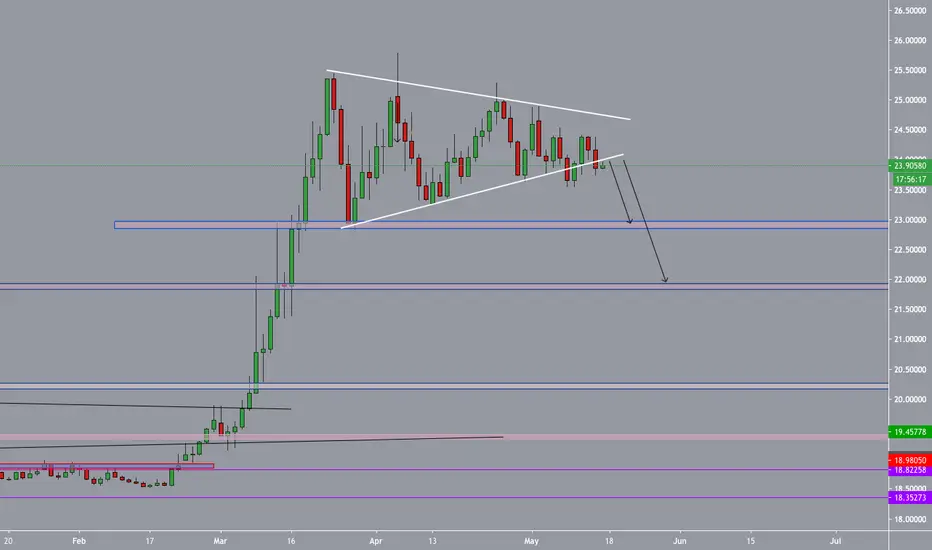
Triangle formation getting printed at the top of USDMXN, been following action price in this one. Daily candles had been respecting the triangle trendiness pretty good. Until a couple of day a daily candle broke outside the trend line and come back quickly inside the consolidation area.
If you see at lower timeframes you would be able to find several patterns that gives sales entries but the most important one is to see that this time price has not been able to to reach the upper trend line. Lets leave the prices to do what if do best, surprise us
If you see at lower timeframes you would be able to find several patterns that gives sales entries but the most important one is to see that this time price has not been able to to reach the upper trend line. Lets leave the prices to do what if do best, surprise us
Anmerkung
Checking on lower timeframes vastest harmonic pattern printed could not complete the D point.Anmerkung
Other pattern formation we can see inside the harmonic formation is the ABCD pattern which actually was the move that printed candles outside the triangular formation and then price move back to inside the triangle just to reach ABCD take profits right at the 0.618 then back to the downside Anmerkung
1H timeframe we can see how the last trend to tu upside was broken and retested leaving two good wicks that advance us that maybe we would not see action price higher that level for a whileAnmerkung
Price has move up again inside the triangle so far respecting 0.618 of the last push down.Also was able to detect a butterfly pattern, completion at the upper triangle trend line and 1.272 fibo extension

Verbundene Veröffentlichungen
Haftungsausschluss
Die Informationen und Veröffentlichungen sind nicht als Finanz-, Anlage-, Handels- oder andere Arten von Ratschlägen oder Empfehlungen gedacht, die von TradingView bereitgestellt oder gebilligt werden, und stellen diese nicht dar. Lesen Sie mehr in den Nutzungsbedingungen.