
USDT Dominance: Bearish Bat; 3 Line Strike; RSI Breakdown
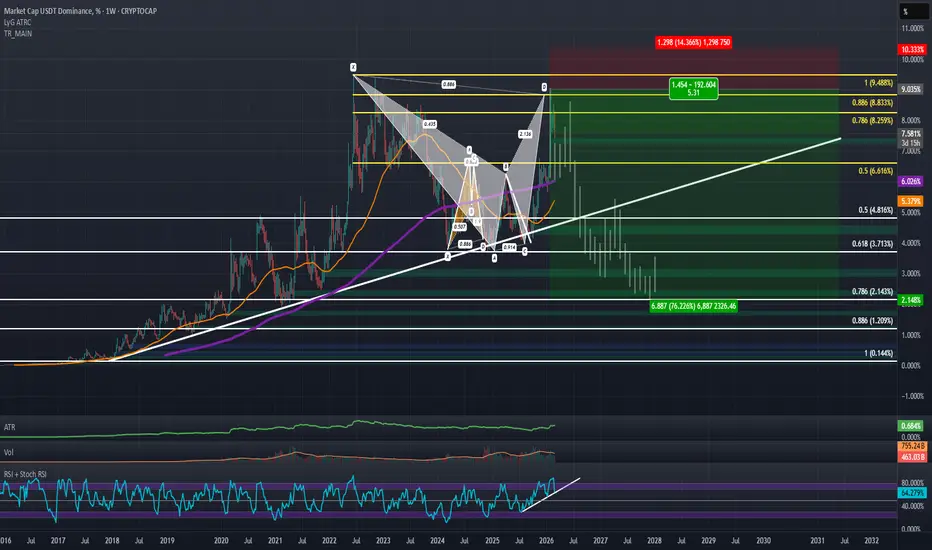
One of the main contributing technical reasons to my recent shift in being Bullish on crypto at these lows has been the USDT Dominance chart. Previously when I was Bearish, USDT.D was holding support at a trendline which aligned with the 61.8% retrace and had developed a local harmonic at the low and during the recent drop in crypto, the USDT Dominance rose back up and made a 0.886 retrace. It just so happens that in the process of doing so USDT.D completed an even bigger potential Bearish Bat Pattern. As its spent the last few weekly candles trading around the 0.886 retrace and rejecting it, the weekly candle now looks like it's going to take out the last few weeks of attempted bullish price action to confirm a Bullish 3 Line Strike which has historically been a very powerful Bearish Reversal candlestick pattern; and to do so on such a high time frame (the weekly) at the 0.886 Completion of this Bearish Bat while showing buyer exhaustion on the RSI which seems close to breaking down its trendline and killing the momentum; seems to all but confirm that the USDT Dominance will see a notable decline in the near future; one that may even result in the break of the uptrend and of the 61.8% retrace. If these supports break the only Harmonic BAMM Target for the USDT Dominance will be down at the lows of the 0.786 or even the 0.886 which from there we could be on the look out for a potential future Bullish Gartley, but for the time being declining to those retraces would result in a 50-80% decline in the US Dollar Dominance within the crypto market, which would mean that on the other end of that trade you will see the TOTAL marketcap dominance of Bitcoin and Other Cryptos start to rise at a similar rate.
Trade ist aktiv
If I were to guess the coins that will gain the most marketcap during this decline in dollar dominance in the order of priority I would say: BTC, XRP, XLM, LTC, TRX, JST, BCH, SOL, and ETH.Anmerkung
We've got 3 lower lows in a row at this PCZ visible on the lower intra-week timeframes and it would seem that on the 3rd lower high it's backtesting the LOBF as resistance, aligning with the 0.786 on the higher timeframe and also the local 0.786 PCZ of a Bearish Gartley on the Lower Timeframe.
Anmerkung
Price reversed from the previous pattern but bounced back from the bottom of the trend. However, upon coming back up it rejected from the top of the Linear Regression Channel for the second time on the weekly timeframe, this time with Bearish Divergence. The reversal this time around is likely to be bigger than the last.

Verbundene Veröffentlichungen
Haftungsausschluss
Die Informationen und Veröffentlichungen sind nicht als Finanz-, Anlage-, Handels- oder andere Arten von Ratschlägen oder Empfehlungen gedacht, die von TradingView bereitgestellt oder gebilligt werden, und stellen diese nicht dar. Lesen Sie mehr in den Nutzungsbedingungen.
Verbundene Veröffentlichungen
Haftungsausschluss
Die Informationen und Veröffentlichungen sind nicht als Finanz-, Anlage-, Handels- oder andere Arten von Ratschlägen oder Empfehlungen gedacht, die von TradingView bereitgestellt oder gebilligt werden, und stellen diese nicht dar. Lesen Sie mehr in den Nutzungsbedingungen.