
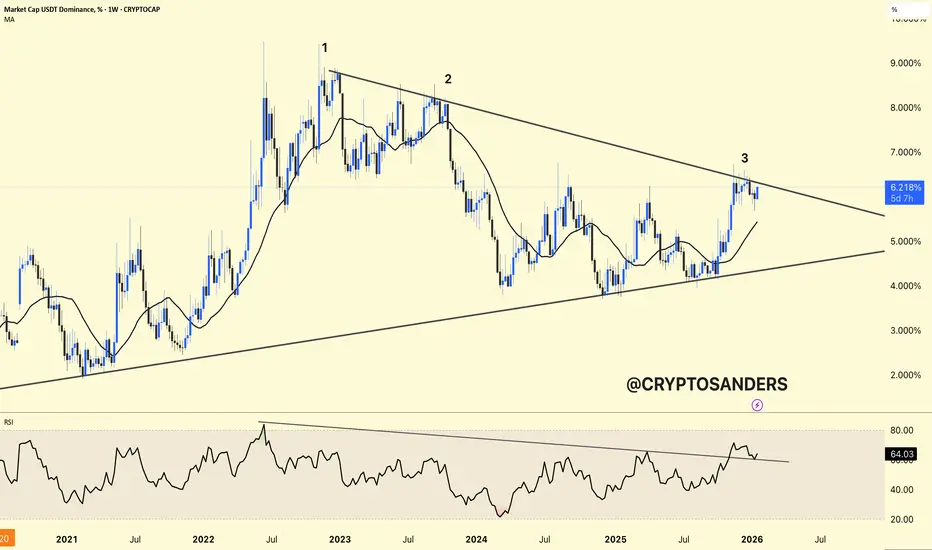
USDT dominance is still grinding inside the rising wedge pattern, with price forming a series of higher lows but showing signs of exhaustion near the upper boundary.
The multi‑year rising wedge has held as the dominant structure since 2022, with the latest bounce from the lower trendline now testing the 6.3–6.5% resistance zone where prior rejections have clustered.
RSI is in a bearish divergence on the weekly timeframe, which often flags the end of these dominance uptrends as capital starts rotating back into risk assets.
As long as dominance stays below 6.5% and holds the lower wedge line around 5.2–5.3%, the bias leans toward a breakdown that could signal stronger altcoin performance ahead.
A clean break below the wedge and 5.2% opens measured downside toward 4% or lower; upside risk to 6.8% remains if it pushes higher, but the pattern suggests reversal is more likely here.
The multi‑year rising wedge has held as the dominant structure since 2022, with the latest bounce from the lower trendline now testing the 6.3–6.5% resistance zone where prior rejections have clustered.
RSI is in a bearish divergence on the weekly timeframe, which often flags the end of these dominance uptrends as capital starts rotating back into risk assets.
As long as dominance stays below 6.5% and holds the lower wedge line around 5.2–5.3%, the bias leans toward a breakdown that could signal stronger altcoin performance ahead.
A clean break below the wedge and 5.2% opens measured downside toward 4% or lower; upside risk to 6.8% remains if it pushes higher, but the pattern suggests reversal is more likely here.

Verbundene Veröffentlichungen
Haftungsausschluss
Die Informationen und Veröffentlichungen sind nicht als Finanz-, Anlage-, Handels- oder andere Arten von Ratschlägen oder Empfehlungen gedacht, die von TradingView bereitgestellt oder gebilligt werden, und stellen diese nicht dar. Lesen Sie mehr in den Nutzungsbedingungen.
Verbundene Veröffentlichungen
Haftungsausschluss
Die Informationen und Veröffentlichungen sind nicht als Finanz-, Anlage-, Handels- oder andere Arten von Ratschlägen oder Empfehlungen gedacht, die von TradingView bereitgestellt oder gebilligt werden, und stellen diese nicht dar. Lesen Sie mehr in den Nutzungsbedingungen.