
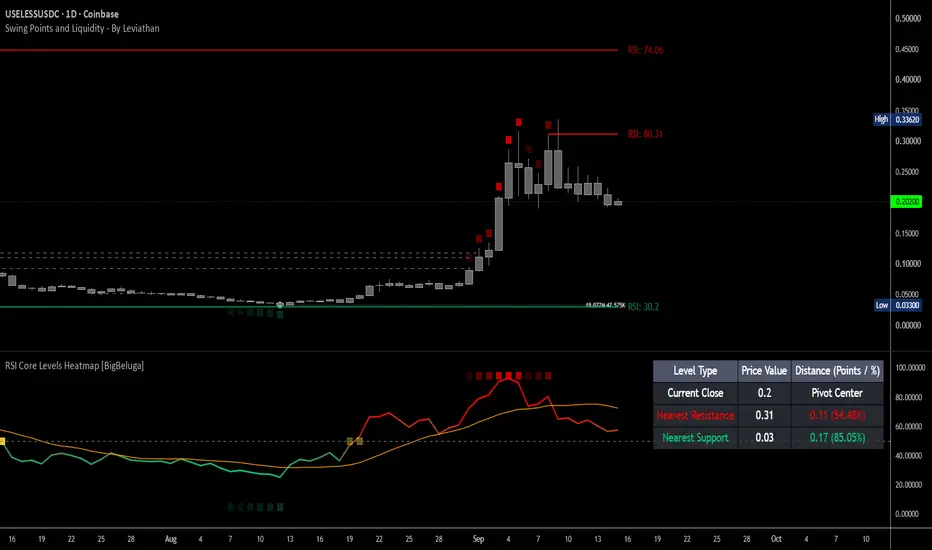
Alright, let's talk about what's happening on USELESS/USDC right now on Coinbase Advanced Spot. The European session gave us a setup that's worth breaking down — extreme order book imbalance, a volume spike, and price sitting above the key moving averages. That combo doesn't show up often.
Exchange Coinbase Advanced Spot
Entry Zone: 0.20590000
Target: 0.21413600 (+4.00%)
Session: European (07:00–12:00 UTC)
Trend Structure — Clean Bullish Backdrop
Price is trading above both the 200 EMA and 200 SMA on the daily. That's the bull/bear line for me. When we're above both, I'm looking for longs, not shorts. Simple as that.
Condition Status
Price > 200 EMA ✅
Price > 200 SMA ✅
Order Book Imbalance: +80.8%
Volume Spike: ≥2.0x ✅
Order Book — Buyers Are Dominating
+80.8% buy-side imbalance. That's about as extreme as it gets. Demand is absolutely crushing displayed sell liquidity right now.
What I'm seeing:
Big players accumulating aggressively
Sellers getting absorbed fast
Price likely has to move up to find real sell pressure
This kind of reading doesn't sit around for long. Either price moves, or the imbalance fades. I'm betting on the former here.
When whales load up, they don't just market buy. They use iceberg orders, let volume dry up, then push. All of that is showing up in this structure.
24h Change: -0.4%
24h Volume: 48.7M
Here's the interesting part price hasn't moved yet. Down 0.4% on the day with an 80% buy imbalance? That's hidden accumulation. Classic pre-breakout behavior.
What I'm Watching
Holding above 0.20590000 if buyers defend this, we're good
Volume expanding toward 0.214136 real breakouts need participation
Imbalance staying elevated if it drops, momentum stalls
Reaction at target I'll consider scaling out if volume keeps pushing
Exchange Coinbase Advanced Spot
Entry Zone: 0.20590000
Target: 0.21413600 (+4.00%)
Session: European (07:00–12:00 UTC)
Trend Structure — Clean Bullish Backdrop
Price is trading above both the 200 EMA and 200 SMA on the daily. That's the bull/bear line for me. When we're above both, I'm looking for longs, not shorts. Simple as that.
Condition Status
Price > 200 EMA ✅
Price > 200 SMA ✅
Order Book Imbalance: +80.8%
Volume Spike: ≥2.0x ✅
Order Book — Buyers Are Dominating
+80.8% buy-side imbalance. That's about as extreme as it gets. Demand is absolutely crushing displayed sell liquidity right now.
What I'm seeing:
Big players accumulating aggressively
Sellers getting absorbed fast
Price likely has to move up to find real sell pressure
This kind of reading doesn't sit around for long. Either price moves, or the imbalance fades. I'm betting on the former here.
When whales load up, they don't just market buy. They use iceberg orders, let volume dry up, then push. All of that is showing up in this structure.
24h Change: -0.4%
24h Volume: 48.7M
Here's the interesting part price hasn't moved yet. Down 0.4% on the day with an 80% buy imbalance? That's hidden accumulation. Classic pre-breakout behavior.
What I'm Watching
Holding above 0.20590000 if buyers defend this, we're good
Volume expanding toward 0.214136 real breakouts need participation
Imbalance staying elevated if it drops, momentum stalls
Reaction at target I'll consider scaling out if volume keeps pushing
Trade geschlossen: Ziel wurde erreicht
The USELESS/USDC long position entered at 0.20590 has been successfully closed after hitting the 0.2141360 take-profit target, delivering a +3.9971% gain in just 6 hours and 37 minutes. The setup played out exactly as anticipated the extreme +80.8% buy-side imbalance, confirmed volume spike, and bullish structure above both the 200 EMA and 200 SMA provided the foundation for a clean, fast move to target. The hidden accumulation phase, where price sat at -0.4% despite overwhelming buyer dominance, proved to be the classic pre-breakout condition that preceded the impulsive move. All targets achieved, trade closed successfully. 
Haftungsausschluss
Die Informationen und Veröffentlichungen sind nicht als Finanz-, Anlage-, Handels- oder andere Arten von Ratschlägen oder Empfehlungen gedacht, die von TradingView bereitgestellt oder gebilligt werden, und stellen diese nicht dar. Lesen Sie mehr in den Nutzungsbedingungen.
Haftungsausschluss
Die Informationen und Veröffentlichungen sind nicht als Finanz-, Anlage-, Handels- oder andere Arten von Ratschlägen oder Empfehlungen gedacht, die von TradingView bereitgestellt oder gebilligt werden, und stellen diese nicht dar. Lesen Sie mehr in den Nutzungsbedingungen.