
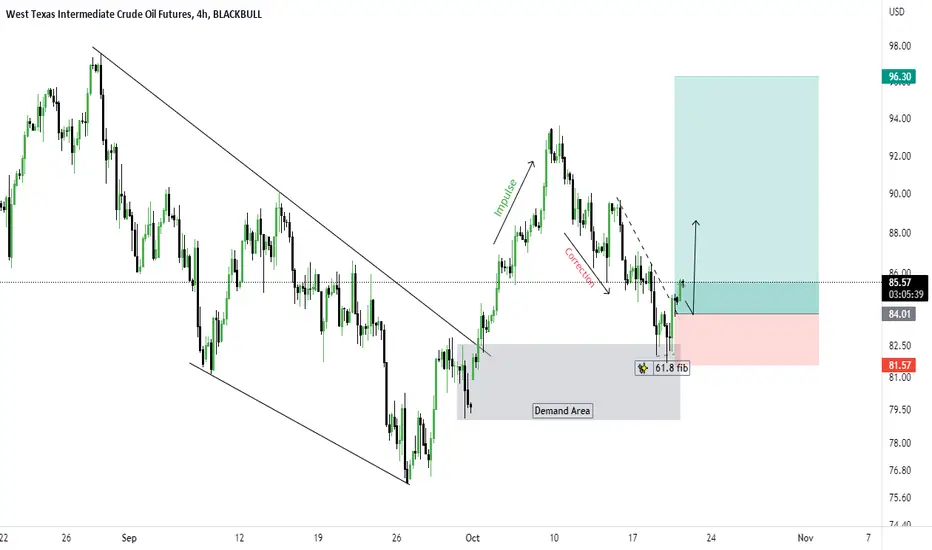
Hello Traders, here's a chart of the UsOil and right now i'm keeping a bullish bias.
Here are my reasons:
- Daily timeframe Break of structure
- H4 bullish impulse and correction into our demand zone
-Demand zone tallying with the 61.8 fib level
-Double bottom at demand zone/fib zone confluence.
I'm putting all these things together from a technical analysis POV. However, there's the fundamentals too and we see an increase in the price of gas cut across different countries since the Russian/Ukraine happenings. Could this be the fundamental backing that our technical thesis needs?
Anyways, don't take me as your single source of truth, and I hope this technical breakdown helps.
Do give us a LIKE and FOLLOW to support us in coming out with more contents.
Here are my reasons:
- Daily timeframe Break of structure
- H4 bullish impulse and correction into our demand zone
-Demand zone tallying with the 61.8 fib level
-Double bottom at demand zone/fib zone confluence.
I'm putting all these things together from a technical analysis POV. However, there's the fundamentals too and we see an increase in the price of gas cut across different countries since the Russian/Ukraine happenings. Could this be the fundamental backing that our technical thesis needs?
Anyways, don't take me as your single source of truth, and I hope this technical breakdown helps.
Do give us a LIKE and FOLLOW to support us in coming out with more contents.

Haftungsausschluss
Die Informationen und Veröffentlichungen sind nicht als Finanz-, Anlage-, Handels- oder andere Arten von Ratschlägen oder Empfehlungen gedacht, die von TradingView bereitgestellt oder gebilligt werden, und stellen diese nicht dar. Lesen Sie mehr in den Nutzungsbedingungen.
Haftungsausschluss
Die Informationen und Veröffentlichungen sind nicht als Finanz-, Anlage-, Handels- oder andere Arten von Ratschlägen oder Empfehlungen gedacht, die von TradingView bereitgestellt oder gebilligt werden, und stellen diese nicht dar. Lesen Sie mehr in den Nutzungsbedingungen.