
Bearish View – Technical Rationale:
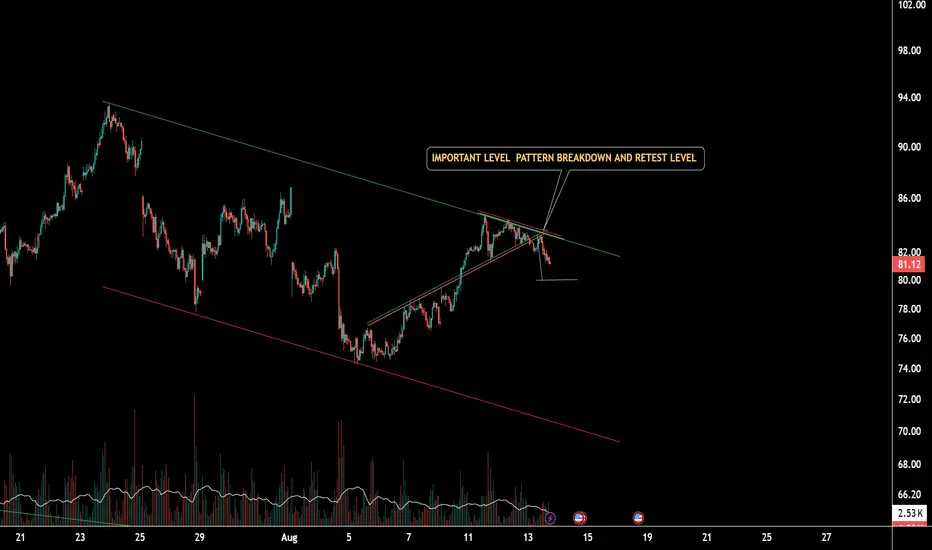
Price has given a breakdown from the rising support trendline, indicating weakness in the previous bullish structure.
The chart shows a contracting/converging pattern, and the breakdown from its lower boundary strengthens the bearish setup.
After the breakdown, price failed to sustain above the 82.00–82.30 resistance/retest zone, suggesting that the broken support is now acting as resistance.
The formation of lower highs followed by a fresh lower low confirms increasing selling pressure.
As long as price remains below the broken structure and the 82.00–82.30 zone, the bearish bias remains valid.
Based on the pattern projection and visible support structure, the first target is 80.00, followed by 79.00.
PATTERN TARGET : 🎯 80.00 → 79.00
DISCLAIMER:
This analysis is provided for educational and informational purposes only and should not be considered financial or investment advice. The view, levels, targets, and technical analysis are based on chart structure and may change with market conditions. Trading in crude oil and other financial instruments involves significant risk, and losses can occur. Always conduct your own analysis and use proper risk management before taking any trade. Past performance does not guarantee future results.
Price has given a breakdown from the rising support trendline, indicating weakness in the previous bullish structure.
The chart shows a contracting/converging pattern, and the breakdown from its lower boundary strengthens the bearish setup.
After the breakdown, price failed to sustain above the 82.00–82.30 resistance/retest zone, suggesting that the broken support is now acting as resistance.
The formation of lower highs followed by a fresh lower low confirms increasing selling pressure.
As long as price remains below the broken structure and the 82.00–82.30 zone, the bearish bias remains valid.
Based on the pattern projection and visible support structure, the first target is 80.00, followed by 79.00.
PATTERN TARGET : 🎯 80.00 → 79.00
DISCLAIMER:
This analysis is provided for educational and informational purposes only and should not be considered financial or investment advice. The view, levels, targets, and technical analysis are based on chart structure and may change with market conditions. Trading in crude oil and other financial instruments involves significant risk, and losses can occur. Always conduct your own analysis and use proper risk management before taking any trade. Past performance does not guarantee future results.

Haftungsausschluss
Die Informationen und Veröffentlichungen sind nicht als Finanz-, Anlage-, Handels- oder andere Arten von Ratschlägen oder Empfehlungen gedacht, die von TradingView bereitgestellt oder gebilligt werden, und stellen diese nicht dar. Lesen Sie mehr in den Nutzungsbedingungen.
Haftungsausschluss
Die Informationen und Veröffentlichungen sind nicht als Finanz-, Anlage-, Handels- oder andere Arten von Ratschlägen oder Empfehlungen gedacht, die von TradingView bereitgestellt oder gebilligt werden, und stellen diese nicht dar. Lesen Sie mehr in den Nutzungsbedingungen.