
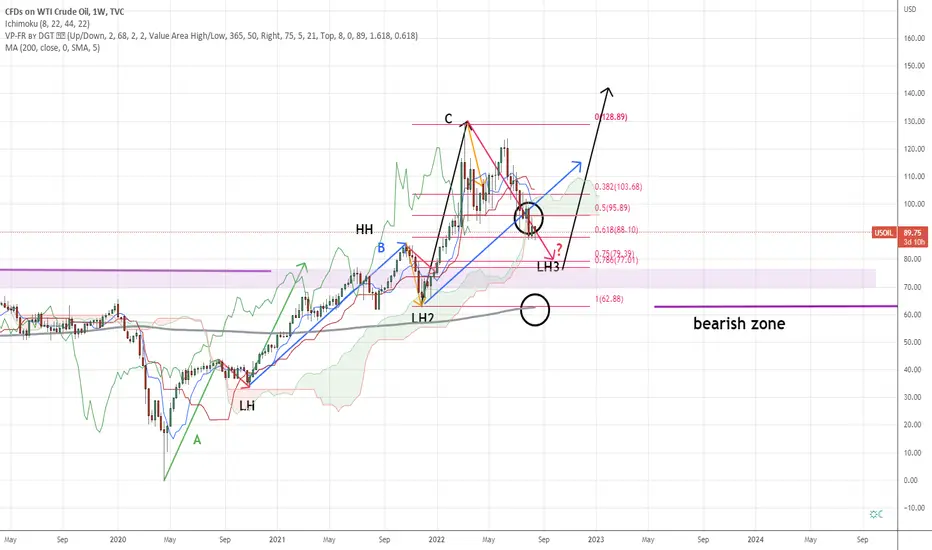
Oil Price still in bullish trend even after retracing from HH2 price of Top of approximately 130 to current 90.
Sign of bullish trend
-Line C having stronger uptrend momentum/strength than line B
-Line C surpass above Fib Extension of 1.272 Line B
-Candlestick above MA200
-Staying above MA(Price approx 63) will still can consider as bullish trend
Some sign of bearish
-Candlestick falling below ichimoku cloud(not bearish confirmation yet)
-lagging Span fall below Candlestick
A closer look on the retracement:
test of downtrend strength within line C

Sign of bullish trend
-Line C having stronger uptrend momentum/strength than line B
-Line C surpass above Fib Extension of 1.272 Line B
-Candlestick above MA200
-Staying above MA(Price approx 63) will still can consider as bullish trend
Some sign of bearish
-Candlestick falling below ichimoku cloud(not bearish confirmation yet)
-lagging Span fall below Candlestick
A closer look on the retracement:
test of downtrend strength within line C

Haftungsausschluss
Die Informationen und Veröffentlichungen sind nicht als Finanz-, Anlage-, Handels- oder andere Arten von Ratschlägen oder Empfehlungen gedacht, die von TradingView bereitgestellt oder gebilligt werden, und stellen diese nicht dar. Lesen Sie mehr in den Nutzungsbedingungen.
Haftungsausschluss
Die Informationen und Veröffentlichungen sind nicht als Finanz-, Anlage-, Handels- oder andere Arten von Ratschlägen oder Empfehlungen gedacht, die von TradingView bereitgestellt oder gebilligt werden, und stellen diese nicht dar. Lesen Sie mehr in den Nutzungsbedingungen.