
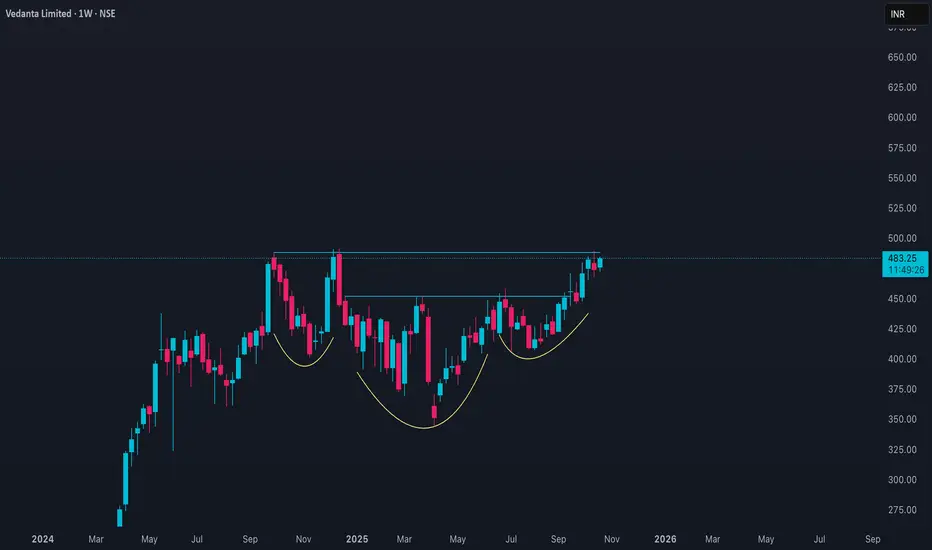
As of October 23, 2025, **Vedanta Limited (VEDL)** closed at around **₹483.25**, up approximately **1.6%** from the previous close near ₹475.65. The stock traded within a range of ₹474.65 to ₹484.85 during the day, reflecting sustained buying interest and moderate volatility.
Vedanta's market capitalization is about **₹1.89 trillion**, making it one of the largest diversified natural resources companies in India. Its earnings per share (EPS) stand at roughly **₹37.11**, with a price-to-earnings (P/E) ratio of around **13.0**, indicating an attractive valuation relative to some peers in the metals and mining sector.
Technically, Vedanta is in a mild uptrend, trading above both the 50-day (₹452.40) and 200-day (₹441.10) moving averages, which represent strong support levels. The Relative Strength Index (RSI) is near 60, indicating strength without being overbought.
Key support is positioned around ₹475, while resistance may be encountered near ₹490–₹495 levels. Overall, the medium-term outlook is positive, supported by stable commodity prices, cost control measures, and steady operational performance. Traders may look for a breakout above ₹490 to confirm further upside potential, while any dip closer to ₹470–₹475 may be viewed as a buying opportunity.
Vedanta's market capitalization is about **₹1.89 trillion**, making it one of the largest diversified natural resources companies in India. Its earnings per share (EPS) stand at roughly **₹37.11**, with a price-to-earnings (P/E) ratio of around **13.0**, indicating an attractive valuation relative to some peers in the metals and mining sector.
Technically, Vedanta is in a mild uptrend, trading above both the 50-day (₹452.40) and 200-day (₹441.10) moving averages, which represent strong support levels. The Relative Strength Index (RSI) is near 60, indicating strength without being overbought.
Key support is positioned around ₹475, while resistance may be encountered near ₹490–₹495 levels. Overall, the medium-term outlook is positive, supported by stable commodity prices, cost control measures, and steady operational performance. Traders may look for a breakout above ₹490 to confirm further upside potential, while any dip closer to ₹470–₹475 may be viewed as a buying opportunity.
Trade ist aktiv
72% + ROI
Haftungsausschluss
Die Informationen und Veröffentlichungen sind nicht als Finanz-, Anlage-, Handels- oder andere Arten von Ratschlägen oder Empfehlungen gedacht, die von TradingView bereitgestellt oder gebilligt werden, und stellen diese nicht dar. Lesen Sie mehr in den Nutzungsbedingungen.
Haftungsausschluss
Die Informationen und Veröffentlichungen sind nicht als Finanz-, Anlage-, Handels- oder andere Arten von Ratschlägen oder Empfehlungen gedacht, die von TradingView bereitgestellt oder gebilligt werden, und stellen diese nicht dar. Lesen Sie mehr in den Nutzungsbedingungen.