
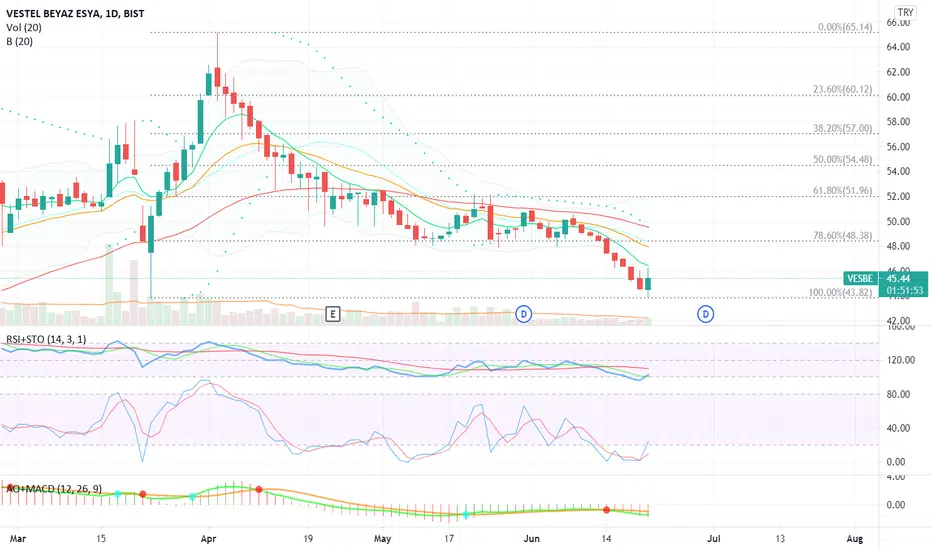
VESBE is technically below (8, 20 and 50 days) moving averages and the recent value is at the bottom of Bollinger Band, but
- RSI cuts up 30
- Stochastic cuts up 20
- Wavetrend is in the oversold area and may need a few more days to cuts up the lower threshold
- Finally, according to its fundamental analysis, VESBE is strong for next 1 year.
I will check VESBE in these days. It touched its 200 days moving average. This point can be a good opportunity to earn up to 10 %. At 48, there is 50 days moving average.
Regards,
Fatih

Haftungsausschluss
Die Informationen und Veröffentlichungen sind nicht als Finanz-, Anlage-, Handels- oder andere Arten von Ratschlägen oder Empfehlungen gedacht, die von TradingView bereitgestellt oder gebilligt werden, und stellen diese nicht dar. Lesen Sie mehr in den Nutzungsbedingungen.
Haftungsausschluss
Die Informationen und Veröffentlichungen sind nicht als Finanz-, Anlage-, Handels- oder andere Arten von Ratschlägen oder Empfehlungen gedacht, die von TradingView bereitgestellt oder gebilligt werden, und stellen diese nicht dar. Lesen Sie mehr in den Nutzungsbedingungen.