
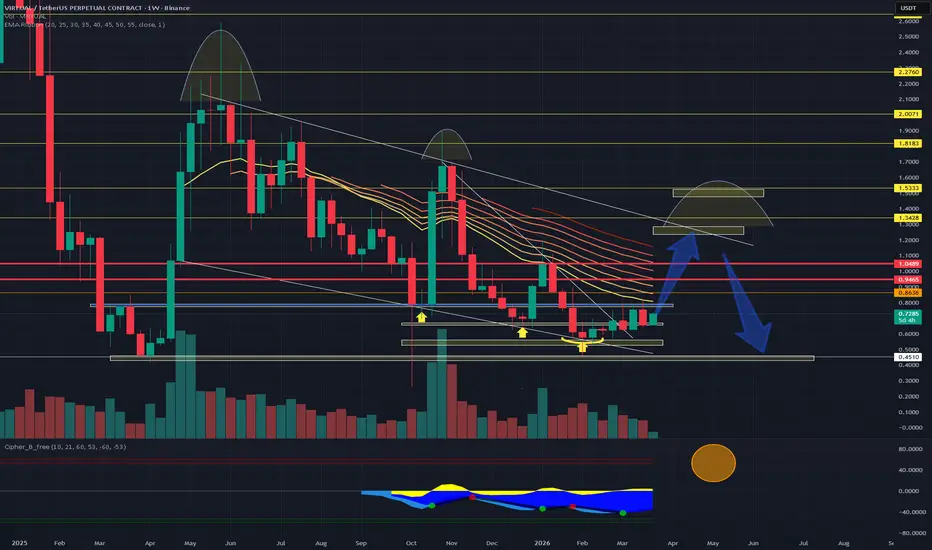
The VIRTUAL/USDT pair is currently confined within a massive Falling Wedge structure that has governed price action since Q2 2025. This 12-month consolidation is reaching its "apex," suggesting a violent volatility expansion is imminent as we move toward the May/June window.
Let me breakdown my thoughts process, as well as the reasoning for this trading idea.
Current Setup & Momentum:
- EMA Ribbon Test: Price is currently hugging the Weekly EMA Ribbon. This serves as the primary "gatekeeper" for bullish momentum. A weekly close above this ribbon would signal the first major trend shift in nearly a year.
- Cipher B Overbought Target: On the 1W timeframe, we are tracking the Cipher B momentum waves. I anticipate a push toward "overbought" conditions (the upper green/red threshold) to coincide with the wedge's upper resistance line.
- The "Liquidity Sweep" (Fake-out): High-volatility AI assets often exhibit a "fake-out" before a true breakout. My thesis includes a potential push to $1.05, followed by a quick retest of the wedge's upper boundary ($0.80-$0.85) to trap early breakout buyers before the final leg toward $1.40–$1.50.
Strategic Rationale:
With VIRTUAL's market cap currently stabilized around $450M the fundamental floor is rising. We are betting on a "rotation" from the ongoing Bittensor (TAO) rally into the high-beta Agentic ecosystem.
You can also study my Bittensor TAO setup to understand the reasoning behind the beta play strategy.
Entry: $0.65 – $0.72 (Accumulation Zone)
TP 1: $1.30 (Previous Resistance)
TP 2: $1.45 (Psychological Level)
TP 3: $1.53 (Target for May/June Expansion)
nfa and good luck.
By Ernst Journal
Let me breakdown my thoughts process, as well as the reasoning for this trading idea.
Current Setup & Momentum:
- EMA Ribbon Test: Price is currently hugging the Weekly EMA Ribbon. This serves as the primary "gatekeeper" for bullish momentum. A weekly close above this ribbon would signal the first major trend shift in nearly a year.
- Cipher B Overbought Target: On the 1W timeframe, we are tracking the Cipher B momentum waves. I anticipate a push toward "overbought" conditions (the upper green/red threshold) to coincide with the wedge's upper resistance line.
- The "Liquidity Sweep" (Fake-out): High-volatility AI assets often exhibit a "fake-out" before a true breakout. My thesis includes a potential push to $1.05, followed by a quick retest of the wedge's upper boundary ($0.80-$0.85) to trap early breakout buyers before the final leg toward $1.40–$1.50.
Strategic Rationale:
With VIRTUAL's market cap currently stabilized around $450M the fundamental floor is rising. We are betting on a "rotation" from the ongoing Bittensor (TAO) rally into the high-beta Agentic ecosystem.
You can also study my Bittensor
TAO setup to understand the reasoning behind the beta play strategy. Entry: $0.65 – $0.72 (Accumulation Zone)
TP 1: $1.30 (Previous Resistance)
TP 2: $1.45 (Psychological Level)
TP 3: $1.53 (Target for May/June Expansion)
nfa and good luck.
By Ernst Journal
Anmerkung
A few additional thoughts.I approach this token as a "double-leveraged" trade. Let me explain why.
Virtual Protocol functions as the liquidity backbone for all sub-agents in its ecosystem. Because agents are paired directly against the VIRTUAL token, any pump in an individual AI agent creates immediate, reflexive buy pressure on VIRTUAL. This creates a "double leverage" effect for holders during high-volatility expansion phases.
Macro thoughts.
We are entering the Q2 window of a Midterm election year. Historically, with the current administration’s approval ratings at local lows, we often see "stimulus-lite" market conditions or "relief rallies" to bolster consumer sentiment before June.
Trade ist aktiv
The trade is still active. It's important to mention, that our SL should set at $0.52 - $0.55
And if the price will go lower, unfortunately the setup will be invalidated and the price will fill that 10/10 wick.


Haftungsausschluss
Die Informationen und Veröffentlichungen sind nicht als Finanz-, Anlage-, Handels- oder andere Arten von Ratschlägen oder Empfehlungen gedacht, die von TradingView bereitgestellt oder gebilligt werden, und stellen diese nicht dar. Lesen Sie mehr in den Nutzungsbedingungen.
Haftungsausschluss
Die Informationen und Veröffentlichungen sind nicht als Finanz-, Anlage-, Handels- oder andere Arten von Ratschlägen oder Empfehlungen gedacht, die von TradingView bereitgestellt oder gebilligt werden, und stellen diese nicht dar. Lesen Sie mehr in den Nutzungsbedingungen.