
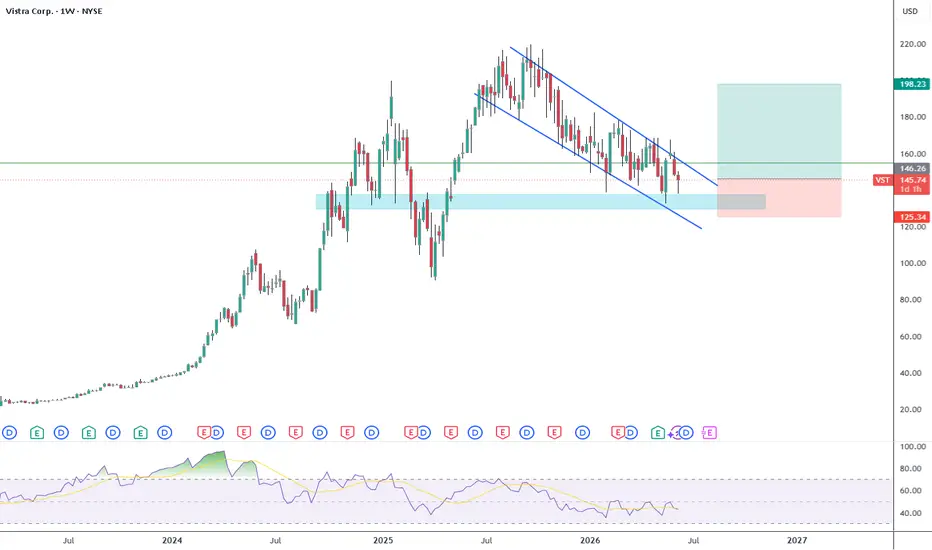
Price has been trading in a descending channel for a year. Looks like it want to break out but it might take a few more weeks. I have a position, if it pulls back to 140 ish and the support holds I'll add. Fundamentals look goo too. SL triggers if a weekly candle breaks down the support shown and closes under it.
Anmerkung
Two consecutives weekly hammer candles. That's very bullish. If it pulls back during next week I will add like crazy.Anmerkung
Wrong drawing above. That's for BMY, another post. Anmerkung
Two day timeframe chart below. Potential double bottom sitting on a strong demand zone. If it breaks up the neck at $167 nothing is going to stop until it makes ATH. It might pull back this week just to take a breath before destroying that neck. I'll add it it pulls back.Anmerkung
Added here. It's going to try to break up the 168 sellers wall again:Anmerkung
Price is forming a rounding bottom. I marked up the resistance levels: at 168 and 178. The price has been poking the 168 resistance for three months. It's going to break up soon:Anmerkung
Poking 168 resistance again. Breakup coming soon:Trade ist aktiv
Looks good. I'm holding this one until for a few more months:Anmerkung
And now it is trading in this channel. The bullish setup got busted. I'll wait until next week to close the position if it doesn't try to break out:
Haftungsausschluss
Die Informationen und Veröffentlichungen sind nicht als Finanz-, Anlage-, Handels- oder andere Arten von Ratschlägen oder Empfehlungen gedacht, die von TradingView bereitgestellt oder gebilligt werden, und stellen diese nicht dar. Lesen Sie mehr in den Nutzungsbedingungen.
Haftungsausschluss
Die Informationen und Veröffentlichungen sind nicht als Finanz-, Anlage-, Handels- oder andere Arten von Ratschlägen oder Empfehlungen gedacht, die von TradingView bereitgestellt oder gebilligt werden, und stellen diese nicht dar. Lesen Sie mehr in den Nutzungsbedingungen.