
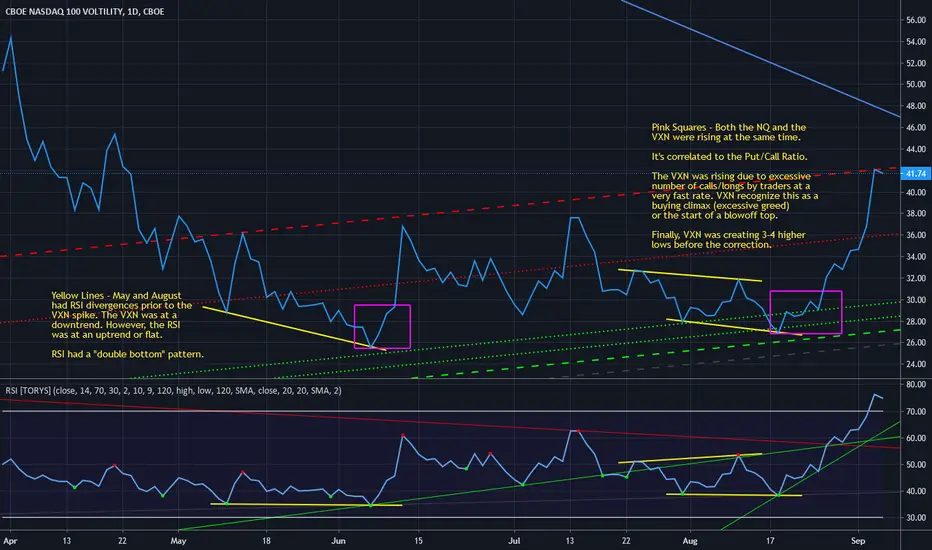
VXN at the daily view.
This is a project that my trading team and I are conducting. This is 3 of 9 charts (available on Trading View) that searches for clues for an imminent correction by using both June and September 2020 cases. It's a comprehensive overview that connects the charts volatility, trends, divergences, credit, and currency strength.
In this chart, the VXN had RSI divergences prior to the corrections. In addition, the VXN created 3-4 higher lows in a row prior to a correction.
This is a project that my trading team and I are conducting. This is 3 of 9 charts (available on Trading View) that searches for clues for an imminent correction by using both June and September 2020 cases. It's a comprehensive overview that connects the charts volatility, trends, divergences, credit, and currency strength.
In this chart, the VXN had RSI divergences prior to the corrections. In addition, the VXN created 3-4 higher lows in a row prior to a correction.

Haftungsausschluss
Die Informationen und Veröffentlichungen sind nicht als Finanz-, Anlage-, Handels- oder andere Arten von Ratschlägen oder Empfehlungen gedacht, die von TradingView bereitgestellt oder gebilligt werden, und stellen diese nicht dar. Lesen Sie mehr in den Nutzungsbedingungen.
Haftungsausschluss
Die Informationen und Veröffentlichungen sind nicht als Finanz-, Anlage-, Handels- oder andere Arten von Ratschlägen oder Empfehlungen gedacht, die von TradingView bereitgestellt oder gebilligt werden, und stellen diese nicht dar. Lesen Sie mehr in den Nutzungsbedingungen.