Long
WAVES-BTC Trade Idea
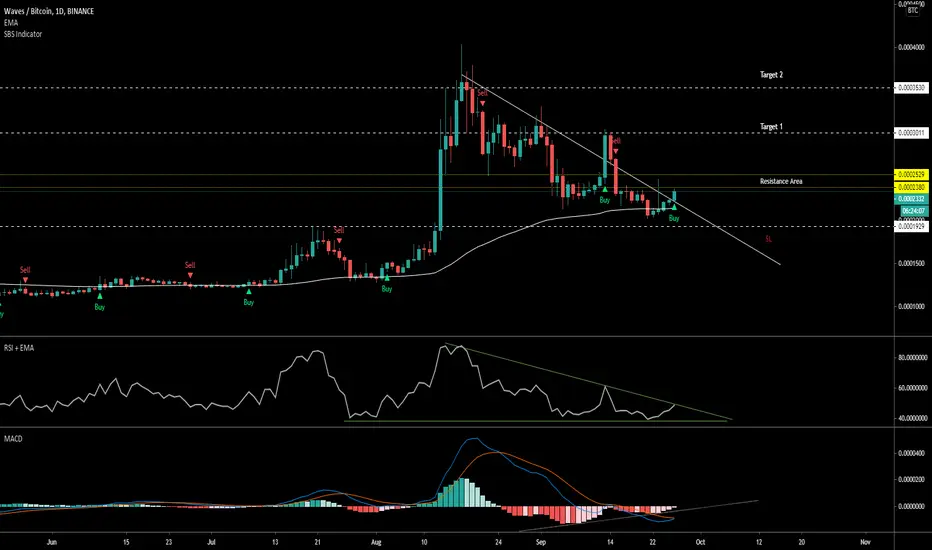
WAVES is breaking out of the trend Line on Daily TF
There is small resistance (Yellow Line) at the Breakout. Break out with good volume will reach Target 1
EMA 89 is acting as a support.
RSI is rising and breakout of the trendline which is acting a diagonal resistance.
MACD is about to cross bullish on Daily chart
MACD histogram is showing Bullish Divergence
SBS Indicator is signaling BUY on Daily chart
Target and SL are on the chart.
Lets see how this plays out.
Trade geschlossen: Ziel wurde erreicht
All targets reached
Tip Jar
PayPal - paypal.me/vickyprudhvi
PayPal - paypal.me/vickyprudhvi
Verbundene Veröffentlichungen
Haftungsausschluss
Die Informationen und Veröffentlichungen sind nicht als Finanz-, Anlage-, Handels- oder andere Arten von Ratschlägen oder Empfehlungen gedacht, die von TradingView bereitgestellt oder gebilligt werden, und stellen diese nicht dar. Lesen Sie mehr in den Nutzungsbedingungen.