
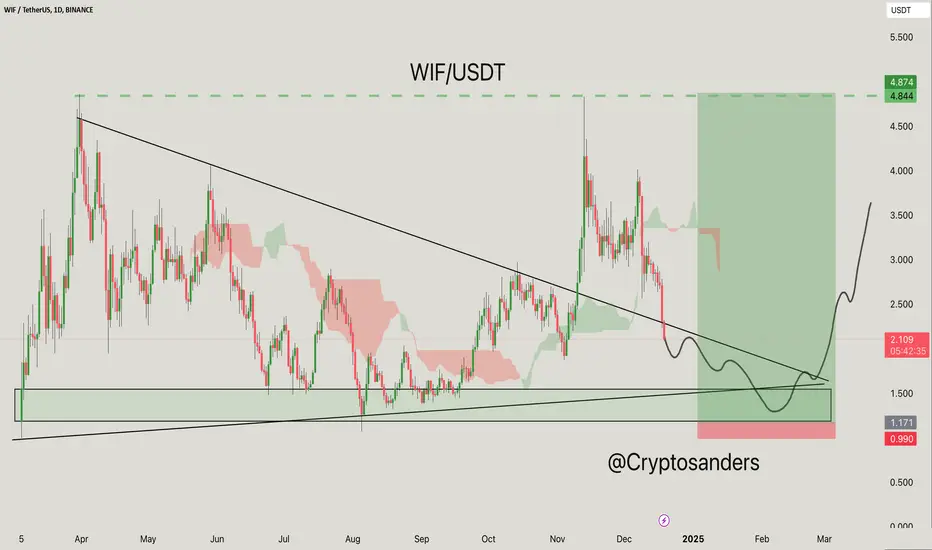
The chart of WIF/USDT shows a potentially bullish setup based on technical analysis.
Descending Triangle Breakout:
The price seems to be approaching the end of the descending triangle, with a potential breakout area of around $2.50.
Support Area:
A significant green area below the current price suggests strong historical support between $0.99 and $1.17.
Ichimoku Cloud:
The behavior of the cloud suggests a transition point, indicating potential bullish momentum if the price breaks above the cloud resistance.
The upward-moving green box shows the long target area of $4.84 to $4.87.
The curve drawn on the chart suggests that the price may fall slightly to the support area before reversing sharply.
Trade Setup:
Entry: Consider buying near the $1.17 support level.
Stop-loss: Place it slightly below $0.99 to manage risk.
Target: Aim at $4.87, which provides a favorable risk-to-profit ratio.
DYOR, NFA
@Peter_CSAdmin

Verbundene Veröffentlichungen
Haftungsausschluss
Die Informationen und Veröffentlichungen sind nicht als Finanz-, Anlage-, Handels- oder andere Arten von Ratschlägen oder Empfehlungen gedacht, die von TradingView bereitgestellt oder gebilligt werden, und stellen diese nicht dar. Lesen Sie mehr in den Nutzungsbedingungen.