Long
Walton Ramping Up
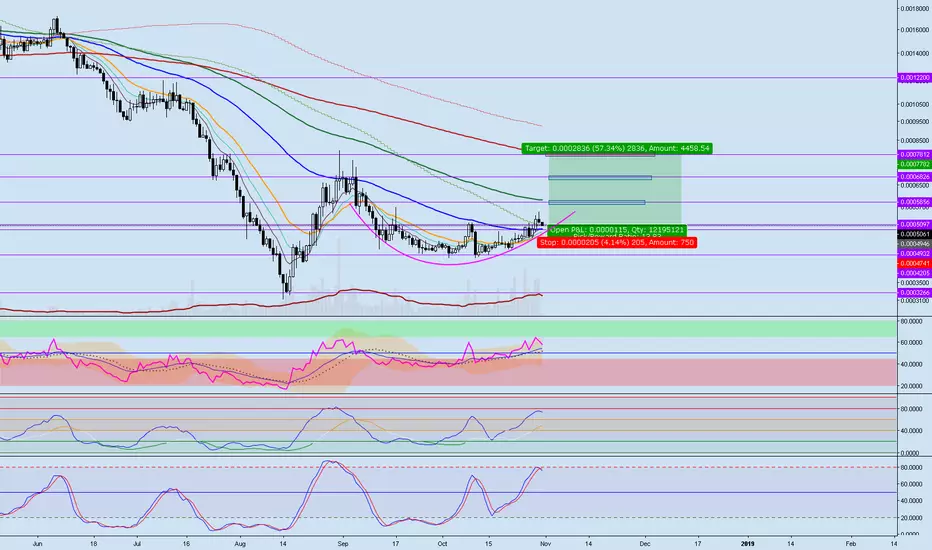
So far it resembles an A&E, but according to books it isn't perfect or very likely isn't even a A&E bottom. Nonetheless, WTC seems to be ramping up. A break and confirmation above 6,9k or 7,9k Sats would make me really bullish. Bearish or neutral if we go below 4,7k again.
+ 1D RSI is above the bearish zone and closer to the bullish area
+ smaller TFs show that most of high volume was on green/white candles
+ 1D is above 55 EMA(blue line) (but the last daily closed as a shooting star or iHammer whatever)
- both Stochs on 1D point to more possible downside, hope 55EMA holds as support
- last daily close, 30th Oct, more bearish than bullish
- bear div on the 12h
+ 1D RSI is above the bearish zone and closer to the bullish area
+ smaller TFs show that most of high volume was on green/white candles
+ 1D is above 55 EMA(blue line) (but the last daily closed as a shooting star or iHammer whatever)
- both Stochs on 1D point to more possible downside, hope 55EMA holds as support
- last daily close, 30th Oct, more bearish than bullish
- bear div on the 12h

Haftungsausschluss
Die Informationen und Veröffentlichungen sind nicht als Finanz-, Anlage-, Handels- oder andere Arten von Ratschlägen oder Empfehlungen gedacht, die von TradingView bereitgestellt oder gebilligt werden, und stellen diese nicht dar. Lesen Sie mehr in den Nutzungsbedingungen.
Haftungsausschluss
Die Informationen und Veröffentlichungen sind nicht als Finanz-, Anlage-, Handels- oder andere Arten von Ratschlägen oder Empfehlungen gedacht, die von TradingView bereitgestellt oder gebilligt werden, und stellen diese nicht dar. Lesen Sie mehr in den Nutzungsbedingungen.