
WTI Poised for a Rally? Key Support Hold Could Send Prices Skywa
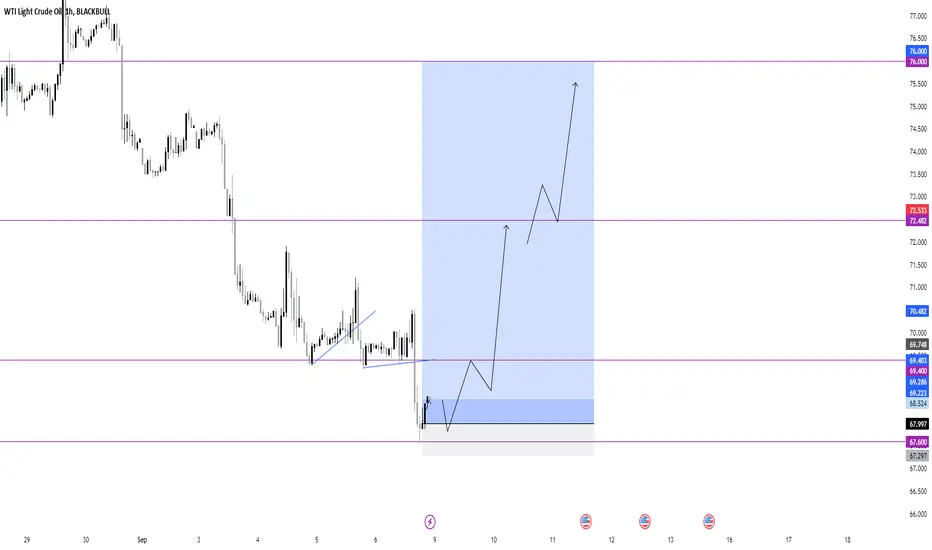
The chart indicates that WTI is approaching a critical support zone between $67.60 and $69.40, a level previously tested and held.
After forming a consolidation pattern, the price is likely to break upward, heading toward the next resistance at $72.50 and potentially extending to $76.00 if momentum builds.
A bullish move would be supported by the price remaining above the $69.40 area, indicating strong demand at these levels.
However, if this support breaks, there could be a further downward move towards $67.60.
The target zones to watch on the upside are $72.50 and $76.00, with significant resistance around those levels.
After forming a consolidation pattern, the price is likely to break upward, heading toward the next resistance at $72.50 and potentially extending to $76.00 if momentum builds.
A bullish move would be supported by the price remaining above the $69.40 area, indicating strong demand at these levels.
However, if this support breaks, there could be a further downward move towards $67.60.
The target zones to watch on the upside are $72.50 and $76.00, with significant resistance around those levels.

iSmashProfit
Verbundene Veröffentlichungen
Haftungsausschluss
Die Informationen und Veröffentlichungen sind nicht als Finanz-, Anlage-, Handels- oder andere Arten von Ratschlägen oder Empfehlungen gedacht, die von TradingView bereitgestellt oder gebilligt werden, und stellen diese nicht dar. Lesen Sie mehr in den Nutzungsbedingungen.
iSmashProfit
Verbundene Veröffentlichungen
Haftungsausschluss
Die Informationen und Veröffentlichungen sind nicht als Finanz-, Anlage-, Handels- oder andere Arten von Ratschlägen oder Empfehlungen gedacht, die von TradingView bereitgestellt oder gebilligt werden, und stellen diese nicht dar. Lesen Sie mehr in den Nutzungsbedingungen.