
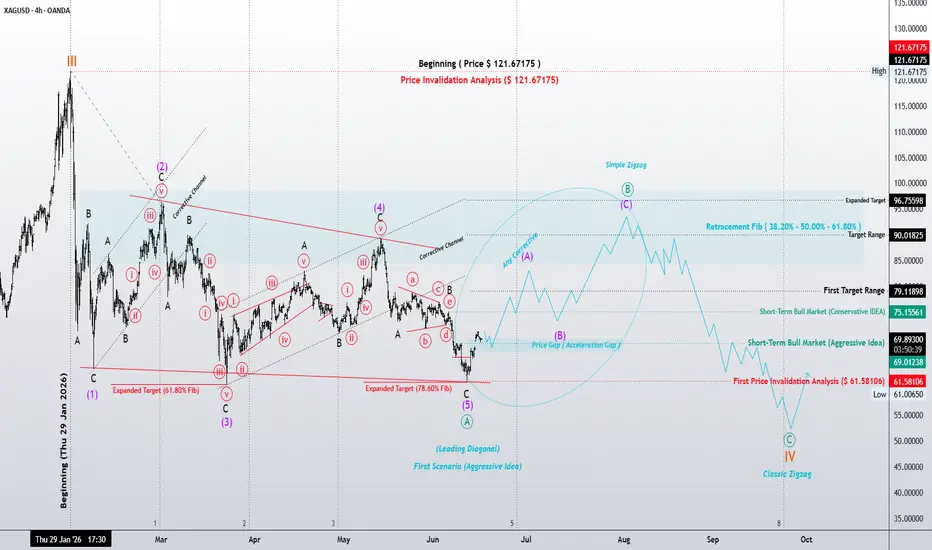
XAGUSD — 4H Structural Map
Following the strict guidelines of The Wave Principle, Silver has concluded a sophisticated bearish sequence in the form of a Leading Diagonal (Wave A of a larger Zigzag). The internal geometry of this structure is a textbook display of the 3-3-3-3-3 sub-wave formula, reflecting the corrective hesitation typical of a trend’s birth.
The Mathematical Blueprint:
The structural integrity is validated by precise Fibonacci proportions:
Wave 3 is not the shortest wave, adhering to the core Elliott Wave tenets.
Wave 3 achieved a 61.8% extension relative to Wave 1.
Wave 5 concluded at a sharp 78.6% extension of Wave 3.
Strategic Roadmap (Aggressive Scenario):
With the diagonal sequence completed, the market is expected to respect the First Price Invalidation level at $61.58. We are now shifting into a corrective recovery phase (Wave B).
The Rebound (Wave B): Expect a minimum of a three-wave corrective rally. The primary upside targets are clustered within the 38.20% - 61.80% retracement zone (targeting the 79.11−79.11−90.01 range).
The Final Descent (Wave C): As this is a Classic Zigzag setup, Wave B will eventually exhaust itself, giving way to a sharp, high-velocity Impulse Wave (Wave C). While Wave A was grinding and diagonal, Wave C is anticipated to be a “strike,” aimed at finalizing the Degree IV correction.
The Edge:
The presence of a minor Acceleration Gap at the terminal of Wave A provides the initial spark for the aggressive long idea. We are watching for price action to validate the pivot before the corrective engine fully engages.
“Patterns don’t lie; they whisper the intent of the crowd before it becomes obvious.”
Patterns whisper, and I listen.
The Wave Principle reflects the social nature of markets.
— Mr. Nobody
Silver / U.S. Dollar
May 19
XAGUSD | 4H Wave Map — A Two-Layer Look at Structure
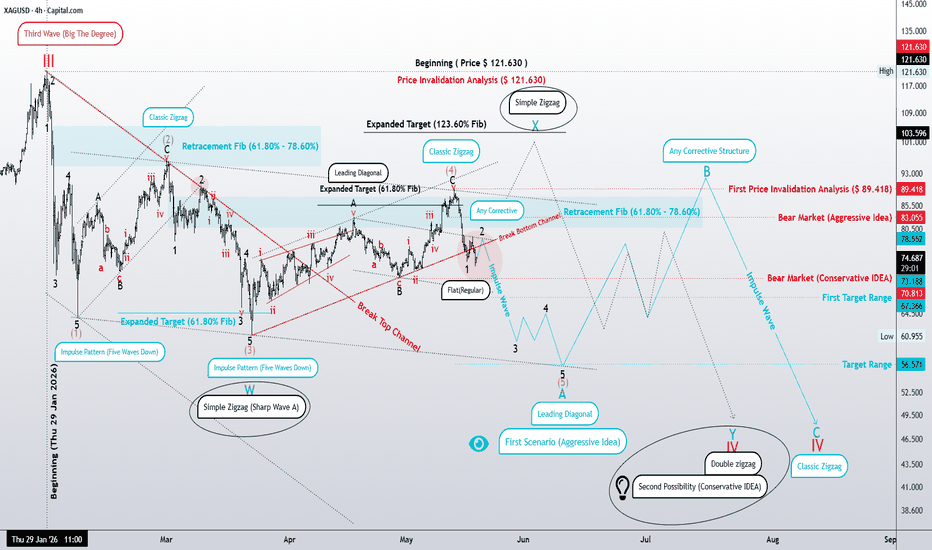
Following the strict guidelines of The Wave Principle, Silver has concluded a sophisticated bearish sequence in the form of a Leading Diagonal (Wave A of a larger Zigzag). The internal geometry of this structure is a textbook display of the 3-3-3-3-3 sub-wave formula, reflecting the corrective hesitation typical of a trend’s birth.
The Mathematical Blueprint:
The structural integrity is validated by precise Fibonacci proportions:
Wave 3 is not the shortest wave, adhering to the core Elliott Wave tenets.
Wave 3 achieved a 61.8% extension relative to Wave 1.
Wave 5 concluded at a sharp 78.6% extension of Wave 3.
Strategic Roadmap (Aggressive Scenario):
With the diagonal sequence completed, the market is expected to respect the First Price Invalidation level at $61.58. We are now shifting into a corrective recovery phase (Wave B).
The Rebound (Wave B): Expect a minimum of a three-wave corrective rally. The primary upside targets are clustered within the 38.20% - 61.80% retracement zone (targeting the 79.11−79.11−90.01 range).
The Final Descent (Wave C): As this is a Classic Zigzag setup, Wave B will eventually exhaust itself, giving way to a sharp, high-velocity Impulse Wave (Wave C). While Wave A was grinding and diagonal, Wave C is anticipated to be a “strike,” aimed at finalizing the Degree IV correction.
The Edge:
The presence of a minor Acceleration Gap at the terminal of Wave A provides the initial spark for the aggressive long idea. We are watching for price action to validate the pivot before the corrective engine fully engages.
“Patterns don’t lie; they whisper the intent of the crowd before it becomes obvious.”
Patterns whisper, and I listen.
The Wave Principle reflects the social nature of markets.
— Mr. Nobody
Silver / U.S. Dollar
May 19
XAGUSD | 4H Wave Map — A Two-Layer Look at Structure

Verbundene Veröffentlichungen
Haftungsausschluss
Die Informationen und Veröffentlichungen sind nicht als Finanz-, Anlage-, Handels- oder andere Arten von Ratschlägen oder Empfehlungen gedacht, die von TradingView bereitgestellt oder gebilligt werden, und stellen diese nicht dar. Lesen Sie mehr in den Nutzungsbedingungen.
Verbundene Veröffentlichungen
Haftungsausschluss
Die Informationen und Veröffentlichungen sind nicht als Finanz-, Anlage-, Handels- oder andere Arten von Ratschlägen oder Empfehlungen gedacht, die von TradingView bereitgestellt oder gebilligt werden, und stellen diese nicht dar. Lesen Sie mehr in den Nutzungsbedingungen.