
📊 Technical Structure
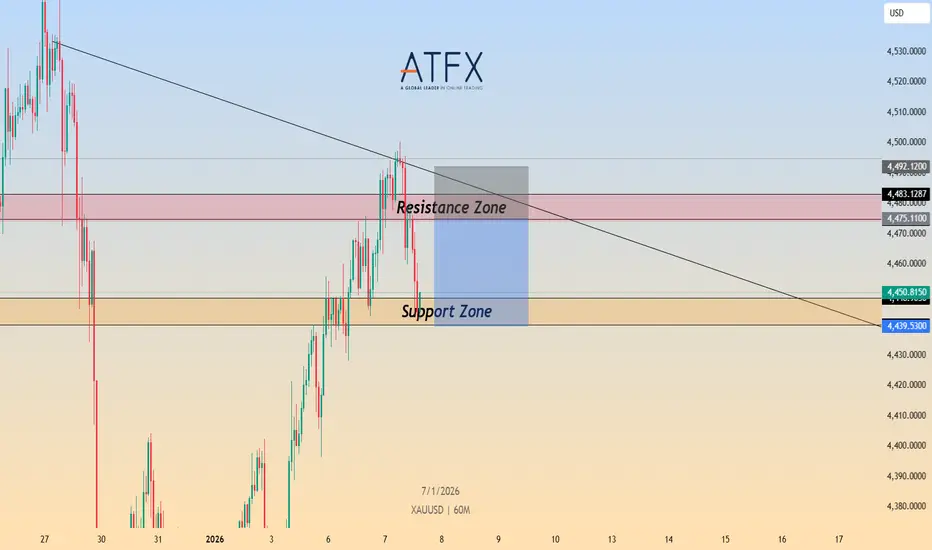
Gold has failed to sustain above the key $4,475–$4,483 resistance zone and is now showing clear signs of rejection from the descending trendline resistance. After a strong rebound from last week’s lows, price stalled at resistance and printed a sharp bearish reaction, suggesting exhaustion of bullish momentum.
On the H1 chart, Gold has broken back below short-term support and is now trading beneath the prior breakout level, turning that zone into resistance. As long as price remains capped below the $4,475–$4,500 region, the structure favours a corrective pullback toward lower support.
🎯 Trade Setup (Bearish Bias)
Entry Zone: 4,475 – 4,483
Stop Loss: 4,492
Take Profit 1: 4,449
Take Profit 2: 4,439
Estimated Risk-to-Reward: approx. 1 : 2.09
➡️ The bearish setup remains valid as long as price fails to reclaim and hold above 4,483 on an hourly closing basis.
🌐 Macro Background (Simplified)
While Gold remains structurally supported in the medium term by expectations of further Federal Reserve rate cuts and ongoing geopolitical risks, short-term positioning is stretched following the recent sharp rally.
Profit-taking has emerged near the $4,500 psychological level as markets await key US macro data, particularly Nonfarm Payrolls (NFP) and inflation signals. In the near term, this creates conditions for a technical correction, even if the broader macro backdrop remains supportive.
In short: fundamentals are supportive medium-term, but short-term price action favours a pullback.
🔑 Key Technical Levels
Resistance Zone: 4,475 – 4,483
Support Zone: 4,449 → 4,439
Bearish Invalidation: Hourly close above 4,483
📌 Trade Summary
Gold has been rejected from major resistance after a strong rebound, with momentum rolling over below the descending trendline. As long as price stays below $4,483, a short-term bearish correction toward $4,449 and $4,439 is favoured. A clean break and acceptance above $4,483 would invalidate the bearish view and shift the bias back to bullish continuation.
⚠️ Disclaimer
This analysis is for reference only and does not constitute trading advice. Financial markets involve significant risk; proper risk and position management are essential.
Gold has failed to sustain above the key $4,475–$4,483 resistance zone and is now showing clear signs of rejection from the descending trendline resistance. After a strong rebound from last week’s lows, price stalled at resistance and printed a sharp bearish reaction, suggesting exhaustion of bullish momentum.
On the H1 chart, Gold has broken back below short-term support and is now trading beneath the prior breakout level, turning that zone into resistance. As long as price remains capped below the $4,475–$4,500 region, the structure favours a corrective pullback toward lower support.
🎯 Trade Setup (Bearish Bias)
Entry Zone: 4,475 – 4,483
Stop Loss: 4,492
Take Profit 1: 4,449
Take Profit 2: 4,439
Estimated Risk-to-Reward: approx. 1 : 2.09
➡️ The bearish setup remains valid as long as price fails to reclaim and hold above 4,483 on an hourly closing basis.
🌐 Macro Background (Simplified)
While Gold remains structurally supported in the medium term by expectations of further Federal Reserve rate cuts and ongoing geopolitical risks, short-term positioning is stretched following the recent sharp rally.
Profit-taking has emerged near the $4,500 psychological level as markets await key US macro data, particularly Nonfarm Payrolls (NFP) and inflation signals. In the near term, this creates conditions for a technical correction, even if the broader macro backdrop remains supportive.
In short: fundamentals are supportive medium-term, but short-term price action favours a pullback.
🔑 Key Technical Levels
Resistance Zone: 4,475 – 4,483
Support Zone: 4,449 → 4,439
Bearish Invalidation: Hourly close above 4,483
📌 Trade Summary
Gold has been rejected from major resistance after a strong rebound, with momentum rolling over below the descending trendline. As long as price stays below $4,483, a short-term bearish correction toward $4,449 and $4,439 is favoured. A clean break and acceptance above $4,483 would invalidate the bearish view and shift the bias back to bullish continuation.
⚠️ Disclaimer
This analysis is for reference only and does not constitute trading advice. Financial markets involve significant risk; proper risk and position management are essential.

ATFX is a globally regulated, award-winning fintech broker offering customer support in 20 languages.
👉🏼Start your trading journey with ATFX: bit.ly/3mLMPHz
👉🏼Start your trading journey with ATFX: bit.ly/3mLMPHz
Haftungsausschluss
Die Informationen und Veröffentlichungen sind nicht als Finanz-, Anlage-, Handels- oder andere Arten von Ratschlägen oder Empfehlungen gedacht, die von TradingView bereitgestellt oder gebilligt werden, und stellen diese nicht dar. Lesen Sie mehr in den Nutzungsbedingungen.
ATFX is a globally regulated, award-winning fintech broker offering customer support in 20 languages.
👉🏼Start your trading journey with ATFX: bit.ly/3mLMPHz
👉🏼Start your trading journey with ATFX: bit.ly/3mLMPHz
Haftungsausschluss
Die Informationen und Veröffentlichungen sind nicht als Finanz-, Anlage-, Handels- oder andere Arten von Ratschlägen oder Empfehlungen gedacht, die von TradingView bereitgestellt oder gebilligt werden, und stellen diese nicht dar. Lesen Sie mehr in den Nutzungsbedingungen.