
1. The Macro Market Maker Curve (Sell Side to Buy Side)
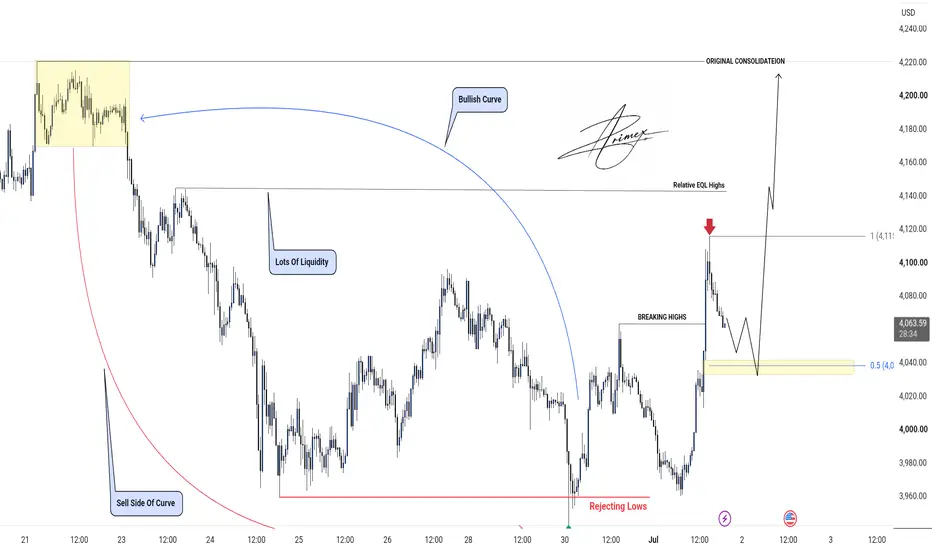
The Original Consolidation: The entire market structure originates from the premium yellow box at the top left (4,190 – 4,220), labeled "ORIGINAL CONSOLIDATEION". This is where institutional money heavily distributed short positions.
Sell Side Of Curve: The large red downward arc tracks the mechanical institutional markdown phase, completely sweeping internal retail support levels on its way down.
The Accumulation Floor: The markdown phase ended at the absolute bottom (~3,950), marked by a green arrow and the text "Rejecting Lows". Institutional algorithms swept the macro sell-side liquidity here, rejecting the lows to establish the major reversal floor.
Bullish Curve: The large blue upward arc marks the official transition to the Buy Side of the Curve, where institutional order flow flips net-long to drive price back to the original consolidation.
2. Intermediate Structure & The Trap
Lots Of Liquidity / Relative EQL Highs: As price rallied off the lows, it left behind a prominent structural ceiling around 4,140. This is explicitly tagged as "Relative EQL Highs" and "Lots Of Liquidity", which serves as an engineered engineering target for buy-stops.
Breaking Highs: The recent minor pullback was aggressively broken to the upside, labeled "BREAKING HIGHS", shifting internal market structure cleanly bullish.
The Premium Rejection: The red arrow at the top right (~4,110) shows price hitting local structural resistance, triggering a healthy, algorithmic pullback to shake out late breakout long traders.
3. Live Market State & Buy Parameters
Live Price: The market is trading live at 4,066.12 with 06:55 left on the current 30-minute candle.
The Tactical Entry Zone: Below current price sits a key horizontal yellow demand block positioned right around the 4,035 – 4,045 discount window.
4. The Projected Expansion Script
The thin black zigzag forecast path details a high-momentum multi-wave continuation plan:
The Discount Mitigation: Price is projected to continue its current local retracement directly into the yellow demand block (~4,040). This dip will fill local fair value gaps and mitigate the order flow shift.
The Momentum Reversal: From this yellow demand box, the script outlines an aggressive, vertical impulse leg up to instantly blast through the recent 4,110 local high.
The Ultimate Target Delivery: The expansion trajectory drives completely vertical to sweep the 4,140 Relative EQL Highs and completely re-balance the market all the way back up to the 4,220 ORIGINAL CONSOLIDATEION ceiling.
The Original Consolidation: The entire market structure originates from the premium yellow box at the top left (4,190 – 4,220), labeled "ORIGINAL CONSOLIDATEION". This is where institutional money heavily distributed short positions.
Sell Side Of Curve: The large red downward arc tracks the mechanical institutional markdown phase, completely sweeping internal retail support levels on its way down.
The Accumulation Floor: The markdown phase ended at the absolute bottom (~3,950), marked by a green arrow and the text "Rejecting Lows". Institutional algorithms swept the macro sell-side liquidity here, rejecting the lows to establish the major reversal floor.
Bullish Curve: The large blue upward arc marks the official transition to the Buy Side of the Curve, where institutional order flow flips net-long to drive price back to the original consolidation.
2. Intermediate Structure & The Trap
Lots Of Liquidity / Relative EQL Highs: As price rallied off the lows, it left behind a prominent structural ceiling around 4,140. This is explicitly tagged as "Relative EQL Highs" and "Lots Of Liquidity", which serves as an engineered engineering target for buy-stops.
Breaking Highs: The recent minor pullback was aggressively broken to the upside, labeled "BREAKING HIGHS", shifting internal market structure cleanly bullish.
The Premium Rejection: The red arrow at the top right (~4,110) shows price hitting local structural resistance, triggering a healthy, algorithmic pullback to shake out late breakout long traders.
3. Live Market State & Buy Parameters
Live Price: The market is trading live at 4,066.12 with 06:55 left on the current 30-minute candle.
The Tactical Entry Zone: Below current price sits a key horizontal yellow demand block positioned right around the 4,035 – 4,045 discount window.
4. The Projected Expansion Script
The thin black zigzag forecast path details a high-momentum multi-wave continuation plan:
The Discount Mitigation: Price is projected to continue its current local retracement directly into the yellow demand block (~4,040). This dip will fill local fair value gaps and mitigate the order flow shift.
The Momentum Reversal: From this yellow demand box, the script outlines an aggressive, vertical impulse leg up to instantly blast through the recent 4,110 local high.
The Ultimate Target Delivery: The expansion trajectory drives completely vertical to sweep the 4,140 Relative EQL Highs and completely re-balance the market all the way back up to the 4,220 ORIGINAL CONSOLIDATEION ceiling.
Trade ist aktiv
Price is still bullish bias Trade geschlossen: Ziel wurde erreicht
Target closed 1000+ pips price is still bias
Daily Forex signals with High Accuracy
🔗 Telegram Channel
t.me/PrimeStrike_Xauusd
Technical and Fundamental analysis
Risk management tips to protect your capital
join now and Start profit
📩 DM On Telegram → @PrimeStrike_Xauusd
🔗 Telegram Channel
t.me/PrimeStrike_Xauusd
Technical and Fundamental analysis
Risk management tips to protect your capital
join now and Start profit
📩 DM On Telegram → @PrimeStrike_Xauusd
Verbundene Veröffentlichungen
Haftungsausschluss
Die Informationen und Veröffentlichungen sind nicht als Finanz-, Anlage-, Handels- oder andere Arten von Ratschlägen oder Empfehlungen gedacht, die von TradingView bereitgestellt oder gebilligt werden, und stellen diese nicht dar. Lesen Sie mehr in den Nutzungsbedingungen.
Daily Forex signals with High Accuracy
🔗 Telegram Channel
t.me/PrimeStrike_Xauusd
Technical and Fundamental analysis
Risk management tips to protect your capital
join now and Start profit
📩 DM On Telegram → @PrimeStrike_Xauusd
🔗 Telegram Channel
t.me/PrimeStrike_Xauusd
Technical and Fundamental analysis
Risk management tips to protect your capital
join now and Start profit
📩 DM On Telegram → @PrimeStrike_Xauusd
Verbundene Veröffentlichungen
Haftungsausschluss
Die Informationen und Veröffentlichungen sind nicht als Finanz-, Anlage-, Handels- oder andere Arten von Ratschlägen oder Empfehlungen gedacht, die von TradingView bereitgestellt oder gebilligt werden, und stellen diese nicht dar. Lesen Sie mehr in den Nutzungsbedingungen.