
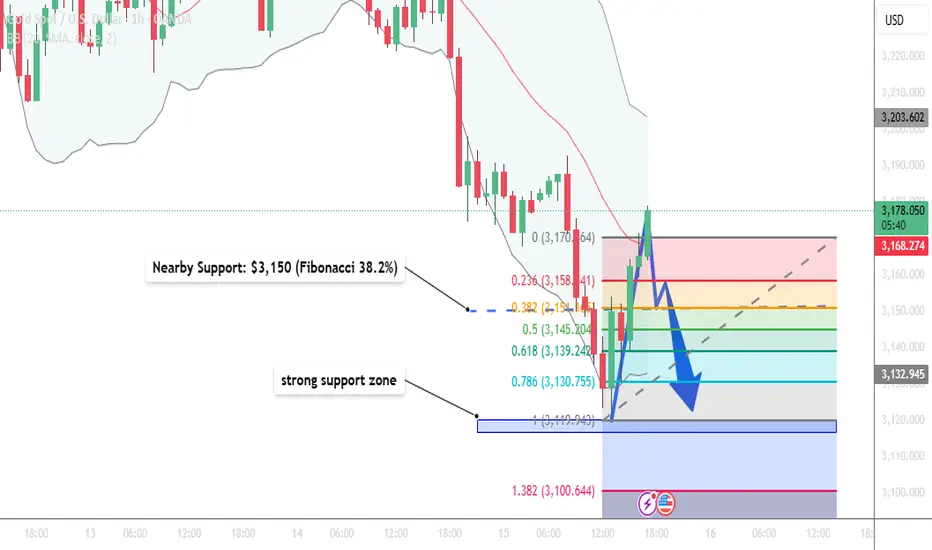
📈 Short-Term Trend Analysis – XAU/USD
On the H1 timeframe, gold price formed a short-term top at $3,170, then sharply declined to the $3,150 area.
The current price action shows a pattern of lower highs and lower lows, indicating a clear bearish trend.
Price has broken below the EMA20 and is trading below the EMA50 on the H1 chart – signaling a loss of bullish momentum in the short term.
This reflects market hesitation ahead of key U.S. economic data and the upcoming Fed speech.
📊 Short-Term Technical Scenario
Main Scenario: SELL ON BREAK OF SUPPORT AT $3,150
Sell Entry: Below $3,148 (confirmation of support break)
Stop Loss (SL): $3,158 (above the 23.6% Fibonacci retracement)
Take Profit (TP):
TP1: $3,139 (Fibonacci 61.8%)
TP2: $3,131 (Fibonacci 78.6%)
TP3: $3,120 (strong support zone, previous swing low)
🔔 Important Notes
Closely monitor Fed Chair Jerome Powell’s speech later today. If he hints at maintaining higher interest rates, gold may continue its downward momentum.
A break below $3,120 would shift the trend from short-term bearish to medium-term bearish, with extended targets around $3,100 – $3,080.
On the H1 timeframe, gold price formed a short-term top at $3,170, then sharply declined to the $3,150 area.
The current price action shows a pattern of lower highs and lower lows, indicating a clear bearish trend.
Price has broken below the EMA20 and is trading below the EMA50 on the H1 chart – signaling a loss of bullish momentum in the short term.
This reflects market hesitation ahead of key U.S. economic data and the upcoming Fed speech.
📊 Short-Term Technical Scenario
Main Scenario: SELL ON BREAK OF SUPPORT AT $3,150
Sell Entry: Below $3,148 (confirmation of support break)
Stop Loss (SL): $3,158 (above the 23.6% Fibonacci retracement)
Take Profit (TP):
TP1: $3,139 (Fibonacci 61.8%)
TP2: $3,131 (Fibonacci 78.6%)
TP3: $3,120 (strong support zone, previous swing low)
🔔 Important Notes
Closely monitor Fed Chair Jerome Powell’s speech later today. If he hints at maintaining higher interest rates, gold may continue its downward momentum.
A break below $3,120 would shift the trend from short-term bearish to medium-term bearish, with extended targets around $3,100 – $3,080.

📊 Forex | Gold | Crypto Market Insights
📰 Real-time news updates & expert analysis
💡 Technical breakdowns & market outlooks
🔗 Join our free group: telegram.me/+DmS-dVFJMm40MDM9
📰 Real-time news updates & expert analysis
💡 Technical breakdowns & market outlooks
🔗 Join our free group: telegram.me/+DmS-dVFJMm40MDM9
Verbundene Veröffentlichungen
Haftungsausschluss
Die Informationen und Veröffentlichungen sind nicht als Finanz-, Anlage-, Handels- oder andere Arten von Ratschlägen oder Empfehlungen gedacht, die von TradingView bereitgestellt oder gebilligt werden, und stellen diese nicht dar. Lesen Sie mehr in den Nutzungsbedingungen.
📊 Forex | Gold | Crypto Market Insights
📰 Real-time news updates & expert analysis
💡 Technical breakdowns & market outlooks
🔗 Join our free group: telegram.me/+DmS-dVFJMm40MDM9
📰 Real-time news updates & expert analysis
💡 Technical breakdowns & market outlooks
🔗 Join our free group: telegram.me/+DmS-dVFJMm40MDM9
Verbundene Veröffentlichungen
Haftungsausschluss
Die Informationen und Veröffentlichungen sind nicht als Finanz-, Anlage-, Handels- oder andere Arten von Ratschlägen oder Empfehlungen gedacht, die von TradingView bereitgestellt oder gebilligt werden, und stellen diese nicht dar. Lesen Sie mehr in den Nutzungsbedingungen.