
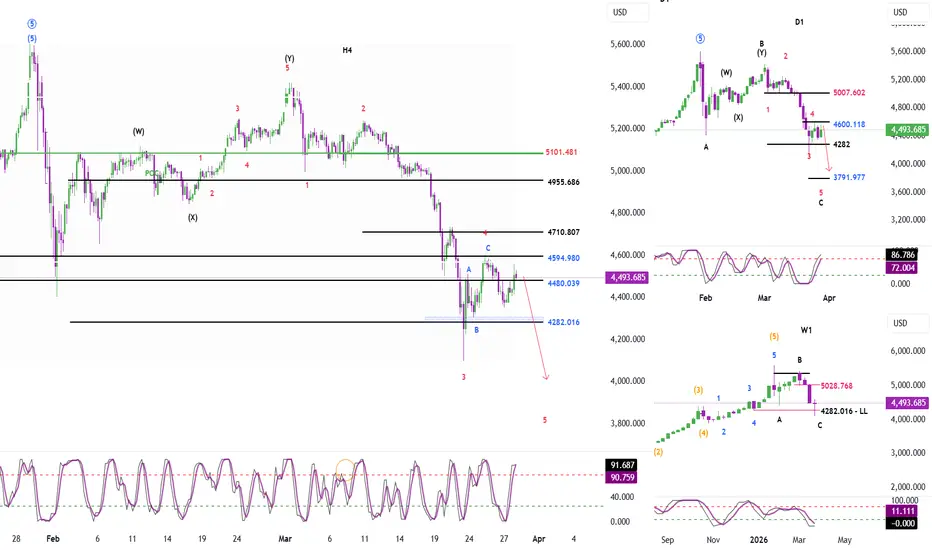
Momentum
– Weekly (W1) momentum is currently preparing to reverse
→ If this week’s candle continues to close bullish
→ It will confirm a reversal in weekly momentum
→ At that point:
– The corrective move of wave C is likely to be completed
– The entire correction phase may end
– And the market could begin a new trend
– Daily (D1) momentum is currently in the oversold zone and preparing to reverse
→ In the next 1–2 days, especially if tomorrow’s daily candle confirms
→ There is a high probability the market will continue the downtrend for the rest of the week
– H4 momentum is decreasing
→ This reflects the momentum from Friday’s closing session
→ Therefore, there is a high probability of a downward move when the market opens tomorrow
Wave Structure
– On W1:
→ The current structure is ABC
→ The minimum target of wave C has been completed
→ If W1 momentum confirms a reversal on the next weekly close
→ The market is likely to transition into a new bullish structure
– On D1:
→ Within wave C, a 5-wave structure (in red) is forming
→ The fact that D1 momentum is preparing to reverse suggests that wave 4 may be nearing completion
→ Expectation:
– Wave 4 could be confirmed complete on Monday or Tuesday
– After that, the final bearish wave 5 (red) may begin
→ Target zone:
– 3791
– On H4:
→ An ABC structure has been completed
→ Price is currently in a corrective upward move
→ However:
– H4 momentum is preparing to reverse downward
→ Therefore, a short-term decline is expected
→ Important note:
– D1 momentum has not yet confirmed a reversal
– We need to wait for Monday’s session to observe whether D1 momentum reverses or continues consolidating
→ Therefore, there are two possible scenarios:
Scenarios
– Scenario 1: Wave 4 continues
→ Price declines, causing H4 momentum to enter the oversold zone
→ But price still holds above 4282
→ In this case:
– Wave 4 is not yet complete
– A complex WXY structure may form
→ Then:
– A bullish move may occur to complete wave Y
→ Target: 4710
– Scenario 2: Strong decline (Wave 5 begins)
→ Price drops and approaches the 4111 zone
→ In this case:
– The market is likely entering wave 5
→ Target:
– 3791
Trading Plan
– Wait for Monday’s session open
– Observe price action and real-time momentum
→ Then:
– Identify which scenario is playing out
– Build a suitable trading plan
Trade ist aktiv
Elliott Wave Analysis XAUUSD – March 30, 2026
Momentum
– D1:
Momentum is showing signs of reversal.
→ We need to wait for today’s daily candle close for confirmation.
→ If confirmed, the market may enter a few days of decline or sideways movement.
– H4:
Momentum is decreasing.
→ It may take another 2–3 H4 candles to reach the oversold zone.
– H1:
Momentum is increasing.
→ In the short term, price may continue to rise or move sideways.
Wave Structure
D1:
– Wave C is forming a 5-wave structure (1–2–3–4–5).
– Price has been moving sideways for about 5 days.
– At the same time, D1 momentum is preparing to reverse.
→ This suggests Wave 4 is likely in its final phase and Wave 5 may be starting.
→ The duration of Wave 5 may coincide with D1 momentum moving into the oversold zone and reversing upward.
H4:
– Price has retraced and is approaching the 4600 level (a key zone).
→ If price breaks above 4600:
→ It will confirm that Wave 4 is still continuing.
→ At this stage, we should monitor H4 momentum:
– If each reversal creates lower highs and lower lows
→ It confirms the bearish structure of Wave 5.
H1:
– Price is currently at the 4480 resistance zone.
– Meanwhile:
H4 momentum is decreasing
H1 momentum is increasing
→ If price continues to move sideways here until H1 reaches overbought:
→ A short-term H1 top is likely to form.
→ If H1 becomes overbought and price reaches 4600:
→ Stay patient, as Wave 4 may still be extending
→ Price could continue higher toward the 4710 zone.
Short-Term Expectation
– Priority scenario: bearish move following H4 momentum.
– When H4 reaches the oversold zone:
→ Price may approach the 4308 area.
→ This is a strong Buy zone based on H4 momentum recovery.
Trading Plan
Entry Conditions:
– H4 momentum reaches oversold
– H1 momentum reaches oversold
– Price approaches the 4308 zone
Buy Zone: 4309 – 4307
SL: 4284
TP1: 4356
TP2: 4480
TP3: 4600

📢 Sometimes signals appear on TradingView with a slight delay!
🚀 Join our Telegram channel to get instant updates and real-time scalping signals:
👉 t.me/+lASNLyXKqcFiYmJl
🚀 Join our Telegram channel to get instant updates and real-time scalping signals:
👉 t.me/+lASNLyXKqcFiYmJl
Verbundene Veröffentlichungen
Haftungsausschluss
Die Informationen und Veröffentlichungen sind nicht als Finanz-, Anlage-, Handels- oder andere Arten von Ratschlägen oder Empfehlungen gedacht, die von TradingView bereitgestellt oder gebilligt werden, und stellen diese nicht dar. Lesen Sie mehr in den Nutzungsbedingungen.
📢 Sometimes signals appear on TradingView with a slight delay!
🚀 Join our Telegram channel to get instant updates and real-time scalping signals:
👉 t.me/+lASNLyXKqcFiYmJl
🚀 Join our Telegram channel to get instant updates and real-time scalping signals:
👉 t.me/+lASNLyXKqcFiYmJl
Verbundene Veröffentlichungen
Haftungsausschluss
Die Informationen und Veröffentlichungen sind nicht als Finanz-, Anlage-, Handels- oder andere Arten von Ratschlägen oder Empfehlungen gedacht, die von TradingView bereitgestellt oder gebilligt werden, und stellen diese nicht dar. Lesen Sie mehr in den Nutzungsbedingungen.