
1️⃣ Market Overview
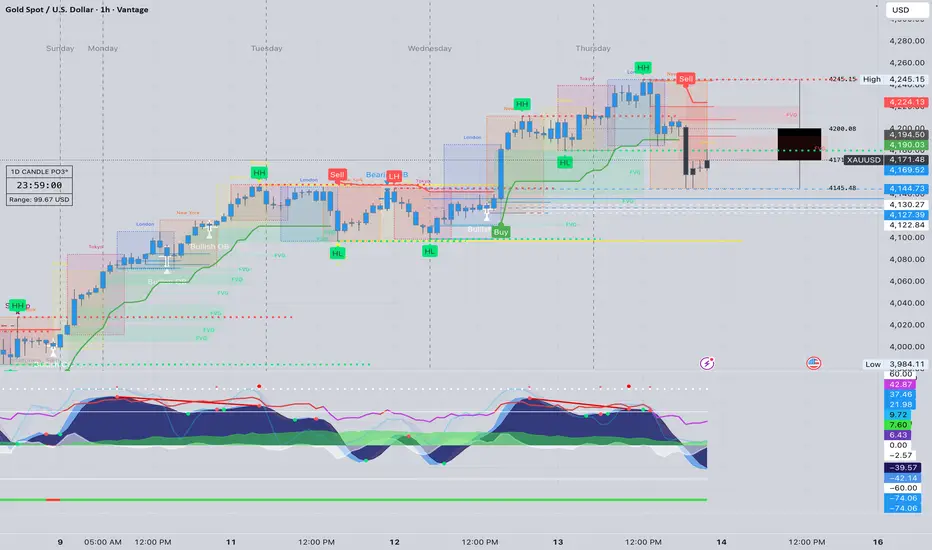
Gold enters the Asia session trading around $4,171, following a strong bearish rejection from the $4,225–$4,245 supply region during the US session. The aggressive sell-off broke several intraday bullish structures and brought price back toward the mid-range of the weekly consolidation.
Buyers are attempting to stabilize price above the 4,160–4,165 intraday support cluster, but momentum remains weak as the descending trendline from $4,245 continues to cap upside attempts.
Gold is currently compressing between a falling intraday trendline and rising 200 EMA support, suggesting a tight coil before the Asia–London volatility window.
⸻
2️⃣ Technical Breakdown
🔹 Daily (D1)
• Gold printed a rejection wick below $4,181, but remains below the daily 10EMA.
• RSI sits at ~61, still bullish but cooling off from overbought levels.
• Daily support at $4,026–$3,920 remains intact.
• A daily close back above $4,200 would signal a bullish re-accumulation, while losing $4,155 risks a deeper pullback into $4,105–$4,098.
⸻
🔹 1H Chart
• Strong bearish momentum from the $4,245 high created a BOS to the downside; structure is now bearish-to-neutral.
• Price is currently stuck under the descending trendline while sitting just above the 200 EMA zone (4,165–4,170).
• RSI around 42, showing sellers still in control.
• MACD histogram is heavily red but flattening, indicating exhaustion from the initial drop.
• Intraday supply sits at 4,185–4,200, while support sits at 4,155–4,165.
⸻
🔹 15M–5M
• Short-term structure shows clear lower highs and repeated failures at 4,174–4,178.
• MACD momentum remains bearish, but weakening — suggesting a possible retest of structure before continuation.
• Asia liquidity is showing compression between rising micro-trendline and descending resistance, forming a symmetrical triangle.
• A breakout from this intraday wedge is likely the session’s decisive move.
⸻
3️⃣ Fibonacci Analysis
Last major swing: 4,098 → 4,245
• 38.2% = 4,189
• 50.0% = 4,171
• 61.8% = 4,153
🎯 Golden Zone: 4,171 – 4,153
Price is currently inside the Golden Zone — a sensitive area for either a bounce or deeper continuation.
⸻
4️⃣ High-Probability Trade Scenarios
📈 BUY SCENARIO (Countertrend Rebound From Golden Zone)
• Entry Zone: 4,171 – 4,153
• Targets:
→ 4,185
→ 4,198
→ 4,210
→ 4,225
• Stop Loss: Below 4,145
• Confirmation: Bullish engulfing or CHoCH on 5M/15M from inside the Fibonacci cluster.
⸻
📉 SELL SCENARIO (Main Bias Due to Rejection at 4,245)
• Entry Zone: 4,185 – 4,198 (intraday supply + descending trendline)
• Targets:
→ 4,171
→ 4,160
→ 4,145
→ 4,125
• Stop Loss: Above 4,205
• Confirmation: Rejection candle, RSI divergence, or repeated failure to break the descending structure.
⸻
💥 Breakout SELL Setup
• Trigger: Break & close below 4,155
• Retest Zone: 4,160–4,165
• Targets:
→ 4,145
→ 4,130
→ 4,105
• Stop Loss: Above 4,175
⸻
💥 Breakout BUY Setup (Alternative)
• Trigger: Break & close above 4,200
• Retest Zone: 4,192–4,198
• Targets:
→ 4,210
→ 4,225
→ 4,245
• Stop Loss: Below 4,185
⸻
5️⃣ Fundamental Watch
• Asia session typically quiet, but markets may position ahead of UoM consumer sentiment and Fed speakers.
• DXY remains soft after failing to hold 106.
• Bond yields are flattening — supportive for gold if sustained.
• No major high-impact news until US session, but pre-positioning may cause spikes.
⸻
6️⃣ Key Technical Levels
Resistance:
• 4,185
• 4,198
• 4,210
• 4,225
• 4,245 (major high)
Support:
• 4,171
• 4,160
• 4,153
• 4,145
• 4,125
Golden Zone:
4,171 – 4,153
Break Sell Trigger: < 4,155
Break Buy Trigger: > 4,200
⸻
7️⃣ Analyst Summary
Gold is currently trading inside a major Fibonacci Golden Zone after a strong rejection from the $4,245 high. While price is stabilizing above the 200 EMA, the structure remains bearish on intraday timeframes. Bears remain in control below 4,198, but bulls may reclaim momentum if they defend 4,153 and break above 4,200.
The market is compressing — expect a decisive breakout during Asia–London.
⸻
8️⃣ Final Bias Summary
📉 Primary Bias: Bearish below 4,198, targeting 4,160 → 4,145 → 4,125
📈 Alternative Bias: Bullish breakout above 4,200, targeting 4,225 → 4,245
⸻
🥇 ElDoradoFx PREMIUM 3.0 – PERFORMANCE 13/11/2025 🥇
📅 High-momentum day with strong continuation on buys + swing dominance.
━━━━━━━━━━━━━━━
🪙 XAU/USD (GOLD) Results
❌ BUY –40 PIPS (SL)
🟢 BUY +210 PIPS
🟢 BUY +110 PIPS
🟢 BUY +60 PIPS
🟢 BUY +210 PIPS
🟢 BUY +60 PIPS
❌ BUY –80 PIPS (SL)
🟢 SELL +210 PIPS
🟡 BUY – BE
🟢 BUY +240 PIPS
---
📈 SWING TRADE UPDATE (From 05/11)
🟩 Current Floating Profit: +2,850 PIPS
Trend still running massively in profit.
━━━━━━━━━━━━━━━
💰 TOTAL DAILY GAIN: +980 PIPS
📊 10 Trades → 7 Wins | 2 SL | 1 BE
🎯 Accuracy: 70%
━━━━━━━━━━━━━━━
🔥 Strong continuation, excellent volatility management, and another winning day for PREMIUM 3.0.
👏 Congratulations if you profited! ✅✅✅🚀🚀🚀
— ElDoradoFx PREMIUM 3.0 Team 💼📈

— ElDoradoFx PREMIUM 3.0 Team 🚀
Haftungsausschluss
Die Informationen und Veröffentlichungen sind nicht als Finanz-, Anlage-, Handels- oder andere Arten von Ratschlägen oder Empfehlungen gedacht, die von TradingView bereitgestellt oder gebilligt werden, und stellen diese nicht dar. Lesen Sie mehr in den Nutzungsbedingungen.
— ElDoradoFx PREMIUM 3.0 Team 🚀
Haftungsausschluss
Die Informationen und Veröffentlichungen sind nicht als Finanz-, Anlage-, Handels- oder andere Arten von Ratschlägen oder Empfehlungen gedacht, die von TradingView bereitgestellt oder gebilligt werden, und stellen diese nicht dar. Lesen Sie mehr in den Nutzungsbedingungen.