
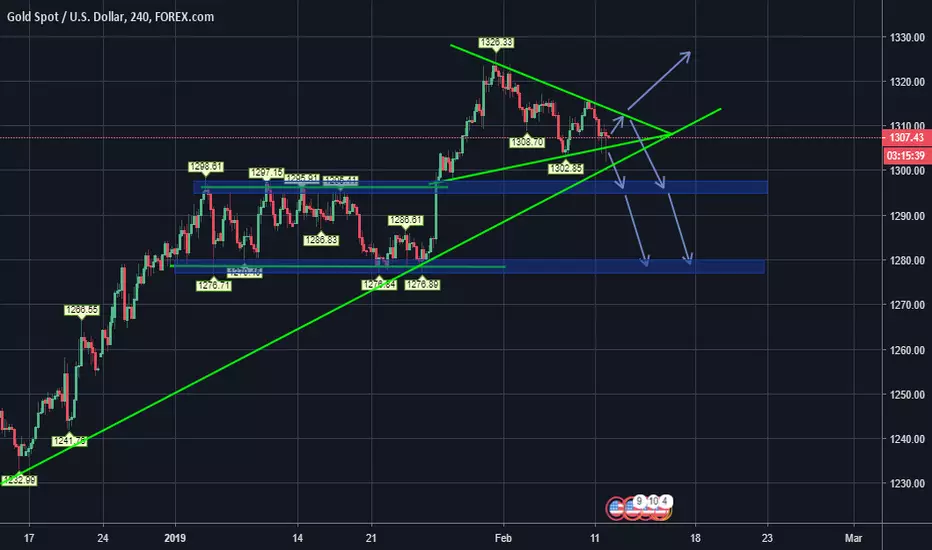
A pennant triangle has formed indicating that price action will break out either above market price or below.
Seeing as gold is currently trading at market highs, the stall in price action suggests it is losing bullish momentum and could therefore break downwards towards precious Support.
Or as due to the longer term bullish trend line it could continue higher to new structure highs and therefore continue bullish trend.
The blue arrows denote possible price action based on the Pennant pattern.
Seeing as gold is currently trading at market highs, the stall in price action suggests it is losing bullish momentum and could therefore break downwards towards precious Support.
Or as due to the longer term bullish trend line it could continue higher to new structure highs and therefore continue bullish trend.
The blue arrows denote possible price action based on the Pennant pattern.
Anmerkung
Pennant broke Bullish.
Haftungsausschluss
Die Informationen und Veröffentlichungen sind nicht als Finanz-, Anlage-, Handels- oder andere Arten von Ratschlägen oder Empfehlungen gedacht, die von TradingView bereitgestellt oder gebilligt werden, und stellen diese nicht dar. Lesen Sie mehr in den Nutzungsbedingungen.
Haftungsausschluss
Die Informationen und Veröffentlichungen sind nicht als Finanz-, Anlage-, Handels- oder andere Arten von Ratschlägen oder Empfehlungen gedacht, die von TradingView bereitgestellt oder gebilligt werden, und stellen diese nicht dar. Lesen Sie mehr in den Nutzungsbedingungen.