
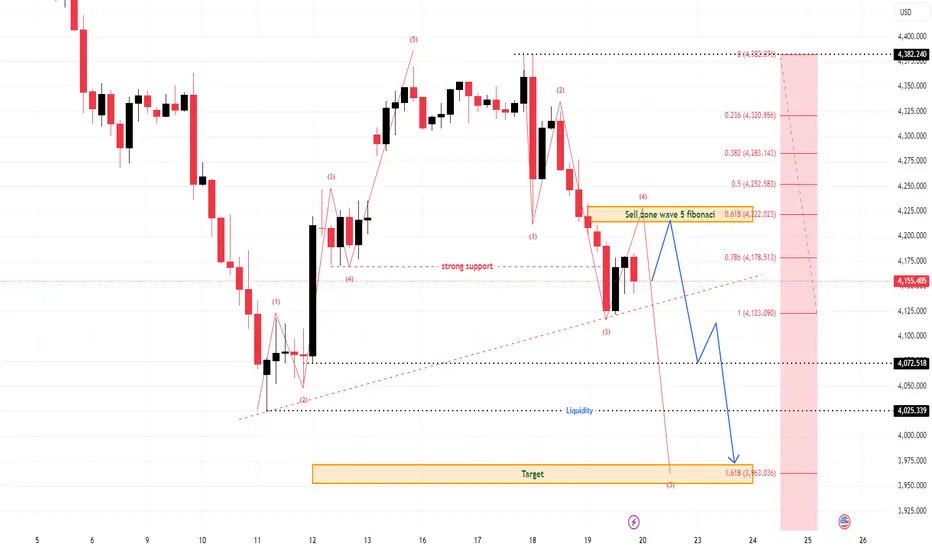
Gold is entering next week with the broader structure still leaning bearish. From Kelly’s view, the latest rebound looks more like a corrective reaction into resistance than the beginning of a strong bullish reversal.
The key idea is simple: as long as gold remains below the wave 5 Fibonacci sell zone, the downside path still has the cleaner structure.
⟡ Market structure
The chart shows gold rejected from the upper range near 4,382, then started forming lower highs and lower lows. Price is now reacting around the 4,155 area, but the recovery remains limited below the 4,220–4,252 resistance region.
The current bounce is important, but it is not enough to change the weekly direction yet. Gold is still trading under the previous strong support zone, and the market continues to leave lower liquidity open.
If sellers defend the 4,178–4,220 area, the next downside phase may continue towards 4,072 first, then 4,025. A stronger weekly wave 5 extension could later target the 3,963 area.
➤ Key levels
◌ 4,178–4,220: wave 5 Fibonacci sell zone
◌ 4,252: higher resistance if the rebound expands
◌ 4,155: current reaction area
◌ 4,123: short-term support
◌ 4,072: first downside confirmation zone
◌ 4,025: liquidity target
◌ 3,963: 1.618 extension and main weekly target
⌁ Elliott Wave view
From an Elliott Wave perspective, gold appears to be developing the next bearish wave sequence after the previous recovery failed near resistance.
The current structure can be read as wave 4 correction developing under the Fibonacci sell zone. If price fails around 4,178–4,220 and starts rejecting again, wave 5 may begin and extend towards the lower liquidity areas.
This makes the current resistance zone very important. A weak rebound into Fibonacci resistance would support the bearish continuation view.
▸ Trading scenario
Preferred scenario: wait for price to recover into the 4,178–4,220 sell zone and show bearish confirmation.
Sell zone: 4,178–4,220 if rejection appears
Stop loss: above 4,252 or above the confirmed rejection high
Take profit 1: 4,072
Take profit 2: 4,025
Take profit 3: 3,963
Alternative scenario: if gold breaks above 4,252 and holds with strong acceptance, the wave 5 bearish setup weakens, and the chart may need a more neutral weekly read.
⌁ Kelly’s view
For Kelly, this is still a sell-the-rebound weekly structure. Gold may bounce first, but the broader Elliott Wave map continues to favour downside continuation while price remains below Fibonacci resistance.
The cleaner plan is not to chase the low. Watch the reaction around 4,178–4,220. If sellers step back in there, wave 5 may continue lower.
Gold is still under weekly pressure. Until resistance is reclaimed, the main structure still favours another bearish leg.
Share your view below.
The key idea is simple: as long as gold remains below the wave 5 Fibonacci sell zone, the downside path still has the cleaner structure.
⟡ Market structure
The chart shows gold rejected from the upper range near 4,382, then started forming lower highs and lower lows. Price is now reacting around the 4,155 area, but the recovery remains limited below the 4,220–4,252 resistance region.
The current bounce is important, but it is not enough to change the weekly direction yet. Gold is still trading under the previous strong support zone, and the market continues to leave lower liquidity open.
If sellers defend the 4,178–4,220 area, the next downside phase may continue towards 4,072 first, then 4,025. A stronger weekly wave 5 extension could later target the 3,963 area.
➤ Key levels
◌ 4,178–4,220: wave 5 Fibonacci sell zone
◌ 4,252: higher resistance if the rebound expands
◌ 4,155: current reaction area
◌ 4,123: short-term support
◌ 4,072: first downside confirmation zone
◌ 4,025: liquidity target
◌ 3,963: 1.618 extension and main weekly target
⌁ Elliott Wave view
From an Elliott Wave perspective, gold appears to be developing the next bearish wave sequence after the previous recovery failed near resistance.
The current structure can be read as wave 4 correction developing under the Fibonacci sell zone. If price fails around 4,178–4,220 and starts rejecting again, wave 5 may begin and extend towards the lower liquidity areas.
This makes the current resistance zone very important. A weak rebound into Fibonacci resistance would support the bearish continuation view.
▸ Trading scenario
Preferred scenario: wait for price to recover into the 4,178–4,220 sell zone and show bearish confirmation.
Sell zone: 4,178–4,220 if rejection appears
Stop loss: above 4,252 or above the confirmed rejection high
Take profit 1: 4,072
Take profit 2: 4,025
Take profit 3: 3,963
Alternative scenario: if gold breaks above 4,252 and holds with strong acceptance, the wave 5 bearish setup weakens, and the chart may need a more neutral weekly read.
⌁ Kelly’s view
For Kelly, this is still a sell-the-rebound weekly structure. Gold may bounce first, but the broader Elliott Wave map continues to favour downside continuation while price remains below Fibonacci resistance.
The cleaner plan is not to chase the low. Watch the reaction around 4,178–4,220. If sellers step back in there, wave 5 may continue lower.
Gold is still under weekly pressure. Until resistance is reclaimed, the main structure still favours another bearish leg.
Share your view below.
Trade ist aktiv
The wave 5 selling zone has been triggered, current profit is 500 pips, the reaction scenario is accurate and needs no change, maintaining the same view.

📌 New analysis published daily
🔔 Follow this profile for real-time updates
⚠️ This is personal analysis, not financial advice
Daily GOLD and Forex updates: t.me/+SOSI26CZOJ1mZDhl
🔔 Follow this profile for real-time updates
⚠️ This is personal analysis, not financial advice
Daily GOLD and Forex updates: t.me/+SOSI26CZOJ1mZDhl
Haftungsausschluss
Die Informationen und Veröffentlichungen sind nicht als Finanz-, Anlage-, Handels- oder andere Arten von Ratschlägen oder Empfehlungen gedacht, die von TradingView bereitgestellt oder gebilligt werden, und stellen diese nicht dar. Lesen Sie mehr in den Nutzungsbedingungen.
📌 New analysis published daily
🔔 Follow this profile for real-time updates
⚠️ This is personal analysis, not financial advice
Daily GOLD and Forex updates: t.me/+SOSI26CZOJ1mZDhl
🔔 Follow this profile for real-time updates
⚠️ This is personal analysis, not financial advice
Daily GOLD and Forex updates: t.me/+SOSI26CZOJ1mZDhl
Haftungsausschluss
Die Informationen und Veröffentlichungen sind nicht als Finanz-, Anlage-, Handels- oder andere Arten von Ratschlägen oder Empfehlungen gedacht, die von TradingView bereitgestellt oder gebilligt werden, und stellen diese nicht dar. Lesen Sie mehr in den Nutzungsbedingungen.