
1️⃣ Market Structure
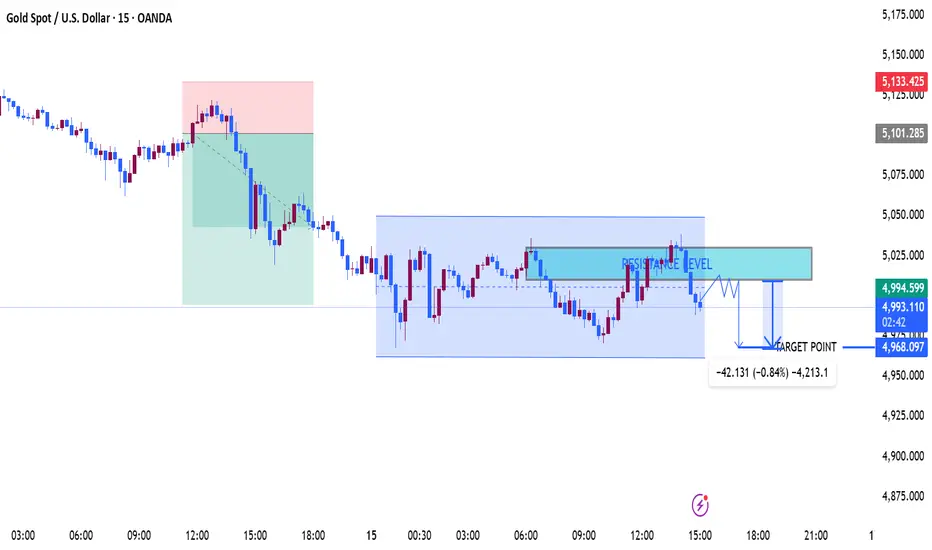
Overall short-term structure is bearish → then consolidation.
Earlier move: Strong bearish impulse (left side of chart).
After that drop: price entered a sideways range (blue box).
Range highs repeatedly rejected near the resistance zone around 5020–5030.
So the market is currently in a distribution / range phase after a downtrend.
2️⃣ Key Levels
🔵 Resistance Zone
≈ 5018 – 5030
Multiple wick rejections.
Liquidity likely resting above these highs.
Sellers clearly defending this level.
🔵 Support Zone
≈ 4965 – 4970
Several reactions.
Range bottom.
3️⃣ Current Price Position
Current price ≈ 4998
This is mid-range, which is usually low-probability for entries.
Professional traders normally prefer:
Sell at range high
Buy at range low
4️⃣ Your Marked Trade Idea (Short)
Your idea appears to be:
Sell from resistance
Target ≈ 4968
Move size shown:
≈ 42 points drop (~0.84%)
This is logical if price confirms rejection again.
5️⃣ Best Scenario for the Short 📉
High-probability setup would be:
Entry zone
➡ 5015 – 5030
Confirmation:
Rejection wick
Bearish engulfing candle
Liquidity sweep above highs
Targets:
TP1: 4990
TP2: 4975
TP3: 4965 (range bottom)
6️⃣ Invalidation 🚫
If price breaks and holds above 5035, then:
Range breakout likely
Next upside zone ≈ 5050 – 5065
✅ Summary
Market: Range after downtrend
Strategy: Sell the resistance
Resistance: 5018–5030
Target: 4970 area
Bias: Slightly bearish
Overall short-term structure is bearish → then consolidation.
Earlier move: Strong bearish impulse (left side of chart).
After that drop: price entered a sideways range (blue box).
Range highs repeatedly rejected near the resistance zone around 5020–5030.
So the market is currently in a distribution / range phase after a downtrend.
2️⃣ Key Levels
🔵 Resistance Zone
≈ 5018 – 5030
Multiple wick rejections.
Liquidity likely resting above these highs.
Sellers clearly defending this level.
🔵 Support Zone
≈ 4965 – 4970
Several reactions.
Range bottom.
3️⃣ Current Price Position
Current price ≈ 4998
This is mid-range, which is usually low-probability for entries.
Professional traders normally prefer:
Sell at range high
Buy at range low
4️⃣ Your Marked Trade Idea (Short)
Your idea appears to be:
Sell from resistance
Target ≈ 4968
Move size shown:
≈ 42 points drop (~0.84%)
This is logical if price confirms rejection again.
5️⃣ Best Scenario for the Short 📉
High-probability setup would be:
Entry zone
➡ 5015 – 5030
Confirmation:
Rejection wick
Bearish engulfing candle
Liquidity sweep above highs
Targets:
TP1: 4990
TP2: 4975
TP3: 4965 (range bottom)
6️⃣ Invalidation 🚫
If price breaks and holds above 5035, then:
Range breakout likely
Next upside zone ≈ 5050 – 5065
✅ Summary
Market: Range after downtrend
Strategy: Sell the resistance
Resistance: 5018–5030
Target: 4970 area
Bias: Slightly bearish
Trade geschlossen: Ziel wurde erreicht

join my telegram channel t.me/goldsignalicthttps://t.me/goldsignalicthttps://t.me/goldsignalict
Haftungsausschluss
Die Informationen und Veröffentlichungen sind nicht als Finanz-, Anlage-, Handels- oder andere Arten von Ratschlägen oder Empfehlungen gedacht, die von TradingView bereitgestellt oder gebilligt werden, und stellen diese nicht dar. Lesen Sie mehr in den Nutzungsbedingungen.
join my telegram channel t.me/goldsignalicthttps://t.me/goldsignalicthttps://t.me/goldsignalict
Haftungsausschluss
Die Informationen und Veröffentlichungen sind nicht als Finanz-, Anlage-, Handels- oder andere Arten von Ratschlägen oder Empfehlungen gedacht, die von TradingView bereitgestellt oder gebilligt werden, und stellen diese nicht dar. Lesen Sie mehr in den Nutzungsbedingungen.