
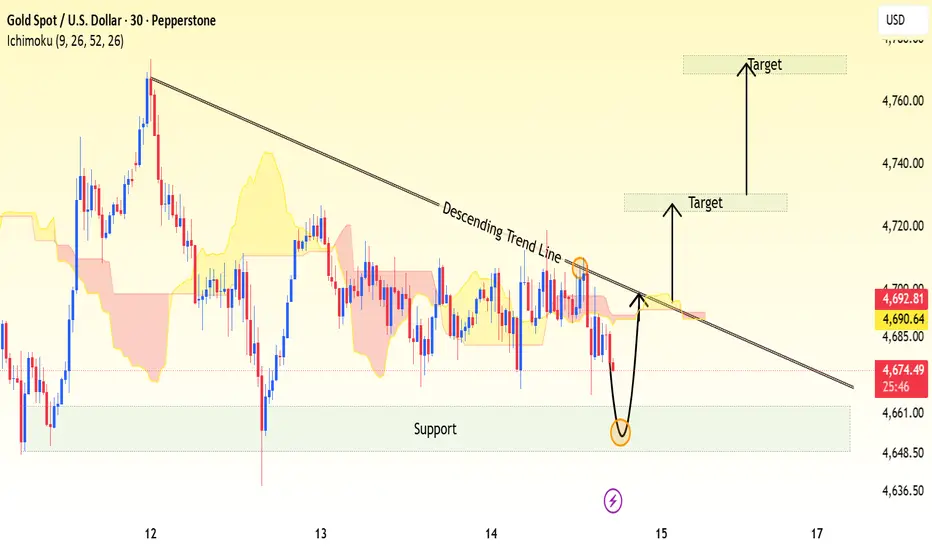
Gold is currently trading inside a short-term bearish structure, respecting a descending trendline that has capped price multiple times. The chart shows price recently sweeping liquidity near the trendline resistance before rejecting lower, indicating sellers are still active in the current range.
However, a strong support zone around 4648 – 4660 remains intact. Price is now approaching this demand area, where a bullish reaction is anticipated. The projected scenario suggests a liquidity grab into support followed by a sharp rebound toward the descending trendline breakout area.
A confirmed breakout and close above the trendline and Ichimoku resistance could open the path toward the first upside target near 4725, with extended bullish momentum potentially reaching the higher target zone around 4770.
Key observations:
Descending trendline acting as dynamic resistance
Strong horizontal support zone holding bearish pressure
Possible liquidity sweep before reversal
Ichimoku cloud resistance near breakout region
Bullish continuation expected after confirmation above trendline
Bullish confirmation: sustained candles above the trendline and cloud resistance.
Invalidation: clean breakdown below the support zone around 4648.
However, a strong support zone around 4648 – 4660 remains intact. Price is now approaching this demand area, where a bullish reaction is anticipated. The projected scenario suggests a liquidity grab into support followed by a sharp rebound toward the descending trendline breakout area.
A confirmed breakout and close above the trendline and Ichimoku resistance could open the path toward the first upside target near 4725, with extended bullish momentum potentially reaching the higher target zone around 4770.
Key observations:
Descending trendline acting as dynamic resistance
Strong horizontal support zone holding bearish pressure
Possible liquidity sweep before reversal
Ichimoku cloud resistance near breakout region
Bullish continuation expected after confirmation above trendline
Bullish confirmation: sustained candles above the trendline and cloud resistance.
Invalidation: clean breakdown below the support zone around 4648.
Trade ist aktiv
its some times happens market moved against my analysis but be ready always for new updates
Click the 🌐Icon to join our telegram channel 📊 Daily XAUUSD(Gold) &Forex Market Analysis 💯Key Levels🎯 Focused on Risk Management ❤️🔥
Charts Tell The Story📊.
t.me/Trade_With_Alixza99
t.me/PRICEACTIONFOREX007
Charts Tell The Story📊.
t.me/Trade_With_Alixza99
t.me/PRICEACTIONFOREX007
Haftungsausschluss
Die Informationen und Veröffentlichungen sind nicht als Finanz-, Anlage-, Handels- oder andere Arten von Ratschlägen oder Empfehlungen gedacht, die von TradingView bereitgestellt oder gebilligt werden, und stellen diese nicht dar. Lesen Sie mehr in den Nutzungsbedingungen.
Click the 🌐Icon to join our telegram channel 📊 Daily XAUUSD(Gold) &Forex Market Analysis 💯Key Levels🎯 Focused on Risk Management ❤️🔥
Charts Tell The Story📊.
t.me/Trade_With_Alixza99
t.me/PRICEACTIONFOREX007
Charts Tell The Story📊.
t.me/Trade_With_Alixza99
t.me/PRICEACTIONFOREX007
Haftungsausschluss
Die Informationen und Veröffentlichungen sind nicht als Finanz-, Anlage-, Handels- oder andere Arten von Ratschlägen oder Empfehlungen gedacht, die von TradingView bereitgestellt oder gebilligt werden, und stellen diese nicht dar. Lesen Sie mehr in den Nutzungsbedingungen.