
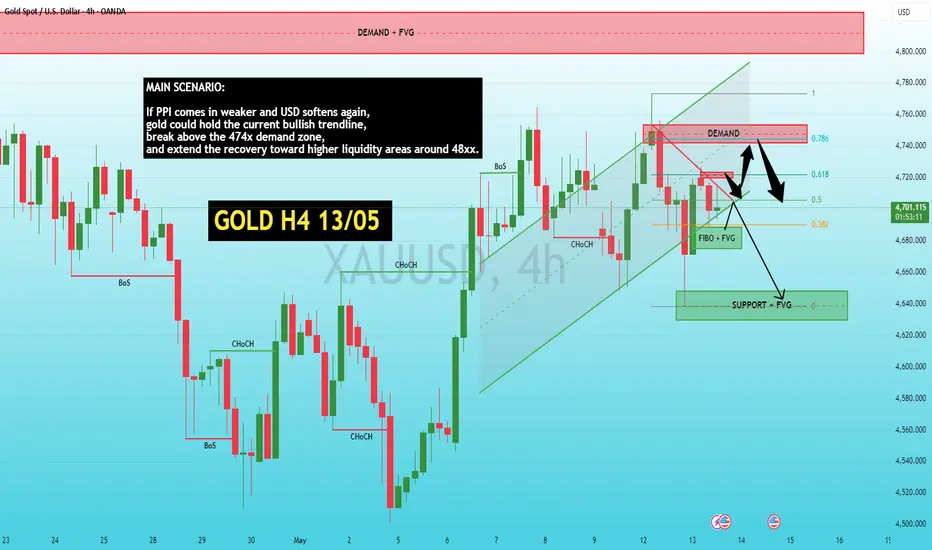
After the sharp CPI-driven selloff earlier this week, gold yesterday showed a clear “false breakdown” structure as price swept liquidity below the short-term bullish trendline into the 464x area but failed to maintain bearish momentum. Instead, the market quickly rejected lower prices and rebounded strongly, confirming that significant liquidity absorption still exists around the lower support zones.
The important point right now is that despite the recovery, gold still has not created a strong enough bullish structure to confirm a sustainable continuation move. Most of the current price action still looks more like a compression phase waiting for a catalyst rather than a confirmed trend reversal.
Tonight, market focus shifts toward the US PPI data. After CPI, inflation-related releases remain extremely important because they directly affect expectations around future FED policy. If PPI remains elevated, USD could regain strength and pressure gold back into another breakdown attempt below current support structures. On the other hand, weaker-than-expected data could support another recovery leg toward the upper demand zones around 474x–48xx.
From a technical perspective, gold is still trading inside a short-term recovery channel while simultaneously trapped between upper demand and lower support + fibo zones. This structure increases the probability of a larger breakout move after tonight’s news release.
MAIN SCENARIO:
If PPI comes in weaker and USD softens again, gold could hold the current bullish trendline, break above the 474x demand zone, and extend the recovery toward higher liquidity areas around 48xx.
ALTERNATIVE SCENARIO:
If PPI surprises stronger or markets begin repricing a more hawkish FED outlook, gold could confirm a breakdown below the current bullish structure and rotate back toward the lower support + FVG zones around 464x–458x.
Overall, gold remains in a post-CPI compression phase after yesterday’s fake breakdown move. The market is now waiting for PPI to determine whether this recovery structure continues higher or becomes another liquidity trap before the broader bearish macro pressure resumes.
LucasGrayTrading
The important point right now is that despite the recovery, gold still has not created a strong enough bullish structure to confirm a sustainable continuation move. Most of the current price action still looks more like a compression phase waiting for a catalyst rather than a confirmed trend reversal.
Tonight, market focus shifts toward the US PPI data. After CPI, inflation-related releases remain extremely important because they directly affect expectations around future FED policy. If PPI remains elevated, USD could regain strength and pressure gold back into another breakdown attempt below current support structures. On the other hand, weaker-than-expected data could support another recovery leg toward the upper demand zones around 474x–48xx.
From a technical perspective, gold is still trading inside a short-term recovery channel while simultaneously trapped between upper demand and lower support + fibo zones. This structure increases the probability of a larger breakout move after tonight’s news release.
MAIN SCENARIO:
If PPI comes in weaker and USD softens again, gold could hold the current bullish trendline, break above the 474x demand zone, and extend the recovery toward higher liquidity areas around 48xx.
ALTERNATIVE SCENARIO:
If PPI surprises stronger or markets begin repricing a more hawkish FED outlook, gold could confirm a breakdown below the current bullish structure and rotate back toward the lower support + FVG zones around 464x–458x.
Overall, gold remains in a post-CPI compression phase after yesterday’s fake breakdown move. The market is now waiting for PPI to determine whether this recovery structure continues higher or becomes another liquidity trap before the broader bearish macro pressure resumes.
LucasGrayTrading
Trade ist aktiv
The PPI tonight continued to significantly exceed expectations, reinforcing hopes that the Fed will maintain high interest rates for longer. This provided renewed support for the USD and put direct pressure on gold immediately after the news.Consistent with the previously mentioned alternative scenario, gold failed to maintain its short-term recovery structure as the price broke through the H2 uptrend line and simultaneously broke down the crucial 0.382 Fibonacci level. After the breakdown, gold experienced a rundown of approximately 300 pips and began trading within a short-term sell range.
Notably, after a series of fake breakouts and recoverys, the market is now gradually confirming a sell bias from a broader macroeconomic perspective. The money flow still lacks sufficient buying momentum, while economic data continues to support the USD.
Currently, the next area to watch is the support and FVG area below around 464x. If this area continues to break down, gold could extend its decline to lower liquidity zones in the coming sessions.
Trade geschlossen: Ziel wurde erreicht
The H4 chart on May 13th continued to move exactly according to the bearish bias outlined earlier. After the failed breakout of the short-term uptrend structure, gold made a final retest around the trendline and demand zone at 471x before entering a sharp breakdown phase, as per the main scenario.Notably, the entire previous rebound only served as a liquidity pullback within the larger downtrend structure. When the price failed to reclaim the demand zone above and was repeatedly rejected at the descending trendline, selling pressure quickly returned, along with strong inflows of USD.
Following the confirmed breakdown, gold fell sharply by 2000 pips from the 471x zone to fill the gap and imbalance below around 451x. This is considered a crucial confirmation for the medium-term downtrend, as the market began to fully shift from a recovery to a distribution phase.
On a macroeconomic level, the market continues to price in a prolonged high-interest rate environment, and the Fed lacks sufficient reason for a strong short-term pivot. This puts significant pressure on gold, despite the lingering recessionary factors in the economy.
Currently, the 451x level is becoming a crucial liquidity support for the entire structure. If this area fails to hold in the coming sessions, gold could continue to extend its sell-off further. Conversely, if there is strong absorption of selling pressure, the market could enter a short-term technical recovery after the recent sharp decline.
Overall, the breakdown from the 471x level to 451x clearly confirms the medium-term downtrend of gold, as outlined in the bias plan.

Daily trend & Supply/Demand insights 📊
👉 t.me/+cZC_DmEr3OwzOTA1
High-probability zones & structured setups
Clear scenarios for better decision-making
Trade smarter with LucasGrayTrading 🎖
👉 t.me/+cZC_DmEr3OwzOTA1
High-probability zones & structured setups
Clear scenarios for better decision-making
Trade smarter with LucasGrayTrading 🎖
Haftungsausschluss
Die Informationen und Veröffentlichungen sind nicht als Finanz-, Anlage-, Handels- oder andere Arten von Ratschlägen oder Empfehlungen gedacht, die von TradingView bereitgestellt oder gebilligt werden, und stellen diese nicht dar. Lesen Sie mehr in den Nutzungsbedingungen.
Daily trend & Supply/Demand insights 📊
👉 t.me/+cZC_DmEr3OwzOTA1
High-probability zones & structured setups
Clear scenarios for better decision-making
Trade smarter with LucasGrayTrading 🎖
👉 t.me/+cZC_DmEr3OwzOTA1
High-probability zones & structured setups
Clear scenarios for better decision-making
Trade smarter with LucasGrayTrading 🎖
Haftungsausschluss
Die Informationen und Veröffentlichungen sind nicht als Finanz-, Anlage-, Handels- oder andere Arten von Ratschlägen oder Empfehlungen gedacht, die von TradingView bereitgestellt oder gebilligt werden, und stellen diese nicht dar. Lesen Sie mehr in den Nutzungsbedingungen.