
Market News:
On Monday (November 3rd) in early Asian trading, gold prices in London were pressured by the dollar index hitting a near three-month high, as hawkish comments from several Federal Reserve officials on Friday reduced the probability of a December rate cut. However, market sentiment remained cautious, as the near-historic US government shutdown and ongoing geopolitical instability continued to support gold prices. International gold prices rose 3.7% in October, marking the third consecutive month of gains. A 53% increase year-to-date further demonstrates the resilience of international gold. It should be noted that North America officially adopted daylight saving time on Sunday (November 2nd). Trading hours for major financial instruments in the US and Canadian financial markets, such as gold, silver, crude oil, and US stocks, as well as the release times of important economic data, will generally be one hour later than during daylight saving time. For traders, remaining on the sidelines in the short term and selectively positioning for positions in the $3800-$4000 range may be the most prudent choice. In the long term, however, the strategic allocation value of gold remains unshaken due to currency depreciation, geopolitical cycles, and central bank gold purchase cycles. This week, attention should be paid to news related to the US government shutdown and speeches by Federal Reserve officials. Additionally, data such as the ISM Manufacturing PMI, ADP employment, the Bank of England's decision, and the Michigan Consumer Sentiment Index should be monitored.
Technical Analysis:
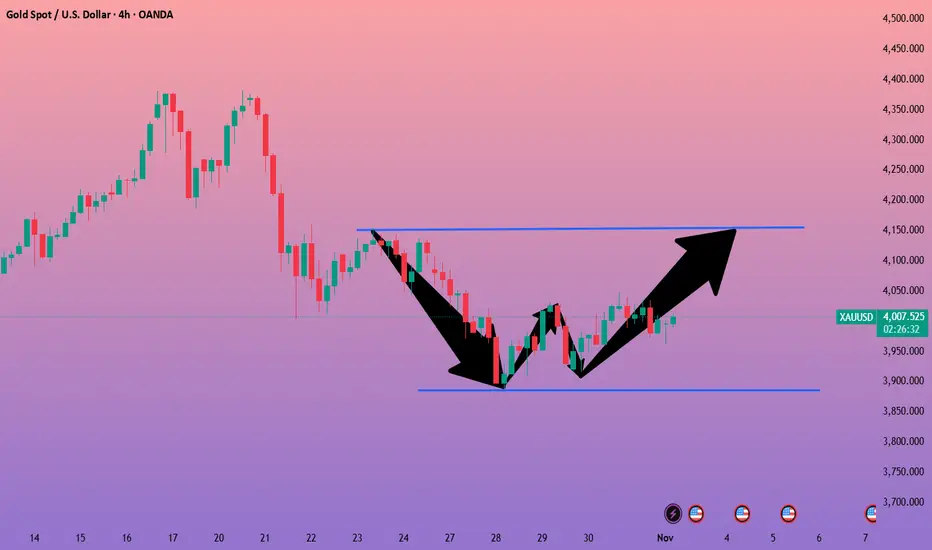
Gold is expected to continue its wide-range consolidation. The monthly chart shows a long upper shadow bullish candlestick, with the price closing near the upper Bollinger Band. The weekly chart shows a bearish candlestick, with the gap down at 4113 still unfilled. The price has retreated to the 10-day moving average support at 3890. The RSI indicator, after a prolonged period of overbought conditions, has turned downwards and is trading below 70. On the daily chart, the 10-day and 7-day moving averages continue to widen downwards to 4028/4000, and the RSI indicator is consolidating around the 50 level. The Bollinger Bands on the short-term 4-hour and hourly charts are narrowing, and the RSI indicator is showing weak consolidation near the lower band. Technically, gold's weak consolidation is likely to continue. However, looking at the longer-term uptrend line, gold is currently still within an upward channel, with key support around $3900. As long as this level is not decisively broken, the long-term uptrend for gold is expected to continue.
Gold Intraday Trading Strategy:
Buy gold at 3930-3935, stop loss at 3920, target 3980-4000;
Sell gold at 4005-4010, stop loss at 4020, target 3950-3920;
Key Levels:
First Support: 3963, Second Support: 3950, Third Support: 3930
First Resistance: 4007, Second Resistance: 4020, Third Resistance: 4038
On Monday (November 3rd) in early Asian trading, gold prices in London were pressured by the dollar index hitting a near three-month high, as hawkish comments from several Federal Reserve officials on Friday reduced the probability of a December rate cut. However, market sentiment remained cautious, as the near-historic US government shutdown and ongoing geopolitical instability continued to support gold prices. International gold prices rose 3.7% in October, marking the third consecutive month of gains. A 53% increase year-to-date further demonstrates the resilience of international gold. It should be noted that North America officially adopted daylight saving time on Sunday (November 2nd). Trading hours for major financial instruments in the US and Canadian financial markets, such as gold, silver, crude oil, and US stocks, as well as the release times of important economic data, will generally be one hour later than during daylight saving time. For traders, remaining on the sidelines in the short term and selectively positioning for positions in the $3800-$4000 range may be the most prudent choice. In the long term, however, the strategic allocation value of gold remains unshaken due to currency depreciation, geopolitical cycles, and central bank gold purchase cycles. This week, attention should be paid to news related to the US government shutdown and speeches by Federal Reserve officials. Additionally, data such as the ISM Manufacturing PMI, ADP employment, the Bank of England's decision, and the Michigan Consumer Sentiment Index should be monitored.
Technical Analysis:
Gold is expected to continue its wide-range consolidation. The monthly chart shows a long upper shadow bullish candlestick, with the price closing near the upper Bollinger Band. The weekly chart shows a bearish candlestick, with the gap down at 4113 still unfilled. The price has retreated to the 10-day moving average support at 3890. The RSI indicator, after a prolonged period of overbought conditions, has turned downwards and is trading below 70. On the daily chart, the 10-day and 7-day moving averages continue to widen downwards to 4028/4000, and the RSI indicator is consolidating around the 50 level. The Bollinger Bands on the short-term 4-hour and hourly charts are narrowing, and the RSI indicator is showing weak consolidation near the lower band. Technically, gold's weak consolidation is likely to continue. However, looking at the longer-term uptrend line, gold is currently still within an upward channel, with key support around $3900. As long as this level is not decisively broken, the long-term uptrend for gold is expected to continue.
Gold Intraday Trading Strategy:
Buy gold at 3930-3935, stop loss at 3920, target 3980-4000;
Sell gold at 4005-4010, stop loss at 4020, target 3950-3920;
Key Levels:
First Support: 3963, Second Support: 3950, Third Support: 3930
First Resistance: 4007, Second Resistance: 4020, Third Resistance: 4038

Haftungsausschluss
Die Informationen und Veröffentlichungen sind nicht als Finanz-, Anlage-, Handels- oder andere Arten von Ratschlägen oder Empfehlungen gedacht, die von TradingView bereitgestellt oder gebilligt werden, und stellen diese nicht dar. Lesen Sie mehr in den Nutzungsbedingungen.
Haftungsausschluss
Die Informationen und Veröffentlichungen sind nicht als Finanz-, Anlage-, Handels- oder andere Arten von Ratschlägen oder Empfehlungen gedacht, die von TradingView bereitgestellt oder gebilligt werden, und stellen diese nicht dar. Lesen Sie mehr in den Nutzungsbedingungen.