
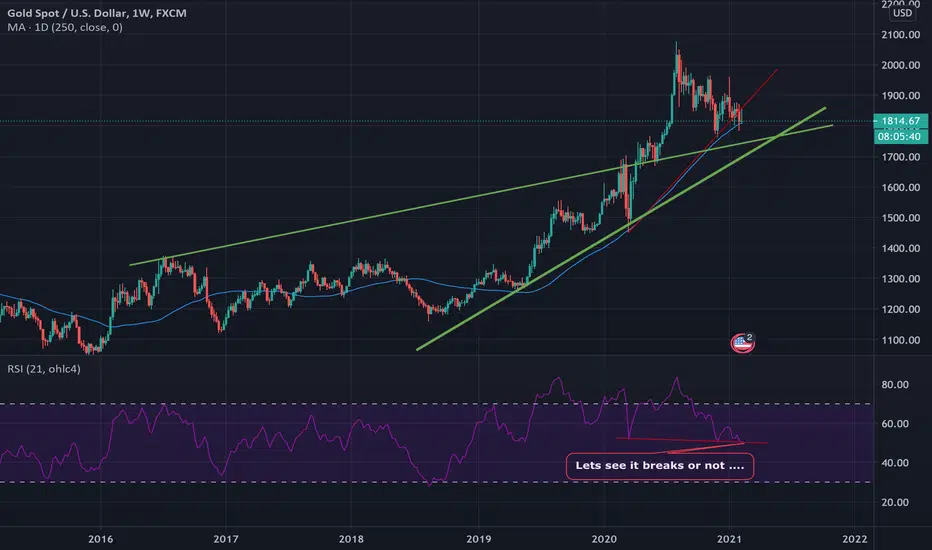
wait for see the price action of weekly canlde against the MA(250) and RSI action Against Red Trend Line
RSI(21) shows us another touch , if Rsi Rejects the Trend Line Below It , a Divergence occurs and price get enough energy to start another bull run.
but if weekly candle closed below daily MA(250) , and RSI red Trend Line break , we should wait for a nice Retracment in price
RSI(21) shows us another touch , if Rsi Rejects the Trend Line Below It , a Divergence occurs and price get enough energy to start another bull run.
but if weekly candle closed below daily MA(250) , and RSI red Trend Line break , we should wait for a nice Retracment in price

that Horizon Beyond Data Flows ...
Verbundene Veröffentlichungen
Haftungsausschluss
Die Informationen und Veröffentlichungen sind nicht als Finanz-, Anlage-, Handels- oder andere Arten von Ratschlägen oder Empfehlungen gedacht, die von TradingView bereitgestellt oder gebilligt werden, und stellen diese nicht dar. Lesen Sie mehr in den Nutzungsbedingungen.
that Horizon Beyond Data Flows ...
Verbundene Veröffentlichungen
Haftungsausschluss
Die Informationen und Veröffentlichungen sind nicht als Finanz-, Anlage-, Handels- oder andere Arten von Ratschlägen oder Empfehlungen gedacht, die von TradingView bereitgestellt oder gebilligt werden, und stellen diese nicht dar. Lesen Sie mehr in den Nutzungsbedingungen.