
Structure
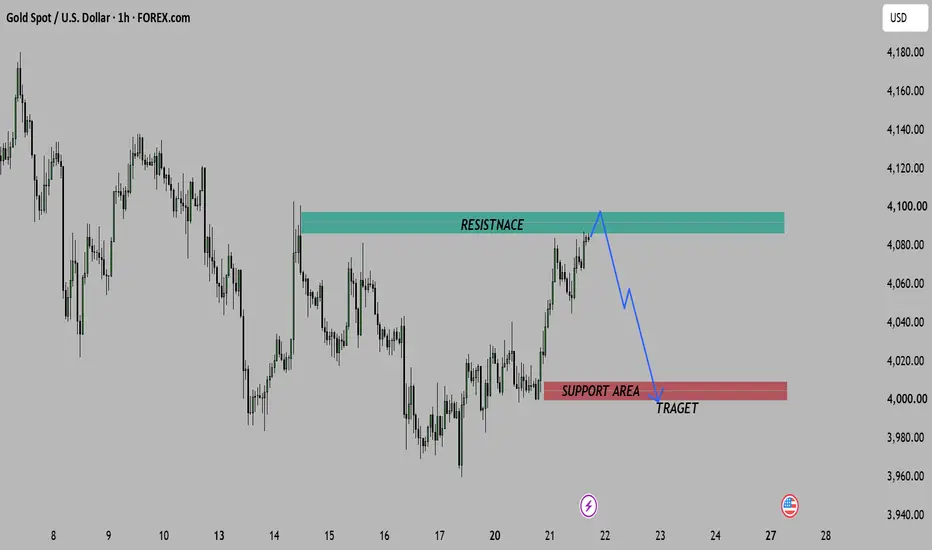
The chart shows that Gold is approaching a major resistance zone around 4,085–4,095 after a strong bullish impulse from approximately 4,000. Price has formed a series of higher highs and higher lows, indicating short-term bullish momentum.
However, the current rally is reaching an area where sellers have previously entered the market.
Key Levels
🟩 Resistance Zone
4,085 – 4,095
Price has tested this area before.
Multiple historical reactions suggest institutional selling interest.
This is the decision zone for the next move.
🟥 Support Zone
3,998 – 4,005
Previous breakout area.
Likely demand zone if price pulls back.
Also aligns with psychological support around 4,000.
What the Chart Suggests
The blue projection indicates the expectation that:
Price makes one final push into resistance.
Buyers fail to break above resistance.
Sellers step in.
Gold retraces toward the support zone near 4,000.
This is essentially a resistance rejection setup.
Bearish Confirmation Signals
A short setup becomes more convincing if you see:
Bearish engulfing candle on the 1H chart
Long upper wick rejection
Lower high after touching resistance
Break below the recent higher low
Increasing bearish volume
Without these confirmations, resistance can still break.
Bullish Invalidation
The bearish idea becomes weaker if:
A 1-hour candle closes decisively above 4,095–4,100.
Price retests the resistance as new support and holds.
Buying volume increases on the breakout.
In that case, the next upside targets could be approximately:
4,115
4,130
4,150
Trade Idea (Based on This Chart)
Bias: Bearish (conditional)
Entry: Wait for bearish confirmation inside the 4,085–4,095 resistance zone.
Stop-loss: Above the resistance zone (for example, above 4,100, depending on your risk tolerance).
Target 1: 4,040
Target 2: 4,020
Target 3: 4,000 (the highlighted support area)
This offers a better risk-to-reward profile than selling before confirmation.
Overall Assessment
Current Trend: Short-term bullish.
Key Resistance: 4,085–4,095.
Expected Scenario: A rejection from resistance leading to a pullback toward the 4,000 support area.
The chart shows that Gold is approaching a major resistance zone around 4,085–4,095 after a strong bullish impulse from approximately 4,000. Price has formed a series of higher highs and higher lows, indicating short-term bullish momentum.
However, the current rally is reaching an area where sellers have previously entered the market.
Key Levels
🟩 Resistance Zone
4,085 – 4,095
Price has tested this area before.
Multiple historical reactions suggest institutional selling interest.
This is the decision zone for the next move.
🟥 Support Zone
3,998 – 4,005
Previous breakout area.
Likely demand zone if price pulls back.
Also aligns with psychological support around 4,000.
What the Chart Suggests
The blue projection indicates the expectation that:
Price makes one final push into resistance.
Buyers fail to break above resistance.
Sellers step in.
Gold retraces toward the support zone near 4,000.
This is essentially a resistance rejection setup.
Bearish Confirmation Signals
A short setup becomes more convincing if you see:
Bearish engulfing candle on the 1H chart
Long upper wick rejection
Lower high after touching resistance
Break below the recent higher low
Increasing bearish volume
Without these confirmations, resistance can still break.
Bullish Invalidation
The bearish idea becomes weaker if:
A 1-hour candle closes decisively above 4,095–4,100.
Price retests the resistance as new support and holds.
Buying volume increases on the breakout.
In that case, the next upside targets could be approximately:
4,115
4,130
4,150
Trade Idea (Based on This Chart)
Bias: Bearish (conditional)
Entry: Wait for bearish confirmation inside the 4,085–4,095 resistance zone.
Stop-loss: Above the resistance zone (for example, above 4,100, depending on your risk tolerance).
Target 1: 4,040
Target 2: 4,020
Target 3: 4,000 (the highlighted support area)
This offers a better risk-to-reward profile than selling before confirmation.
Overall Assessment
Current Trend: Short-term bullish.
Key Resistance: 4,085–4,095.
Expected Scenario: A rejection from resistance leading to a pullback toward the 4,000 support area.
Trade ist aktiv

8𝐏𝐋𝐔𝐒 𝐘𝐄𝐀𝐑 𝐄𝐗𝐏𝐄𝐑𝐈𝐄𝐍𝐂𝐄
👇👇👇👇👇
t.me/Technical_Trader79
3/5 𝐃𝐀𝐈𝐋𝐘 𝐅𝐎𝐑𝐄𝐗 𝐂𝐑𝐘𝐏𝐓𝐎 𝐓𝐑𝐀𝐃𝐈𝐍𝐆 𝐒𝐈𝐆𝐍𝐀𝐋𝐒
👇👇👇👇👇
t.me/Technical_Trader79
👇👇👇👇👇
t.me/Technical_Trader79
3/5 𝐃𝐀𝐈𝐋𝐘 𝐅𝐎𝐑𝐄𝐗 𝐂𝐑𝐘𝐏𝐓𝐎 𝐓𝐑𝐀𝐃𝐈𝐍𝐆 𝐒𝐈𝐆𝐍𝐀𝐋𝐒
👇👇👇👇👇
t.me/Technical_Trader79
Haftungsausschluss
Die Informationen und Veröffentlichungen sind nicht als Finanz-, Anlage-, Handels- oder andere Arten von Ratschlägen oder Empfehlungen gedacht, die von TradingView bereitgestellt oder gebilligt werden, und stellen diese nicht dar. Lesen Sie mehr in den Nutzungsbedingungen.
8𝐏𝐋𝐔𝐒 𝐘𝐄𝐀𝐑 𝐄𝐗𝐏𝐄𝐑𝐈𝐄𝐍𝐂𝐄
👇👇👇👇👇
t.me/Technical_Trader79
3/5 𝐃𝐀𝐈𝐋𝐘 𝐅𝐎𝐑𝐄𝐗 𝐂𝐑𝐘𝐏𝐓𝐎 𝐓𝐑𝐀𝐃𝐈𝐍𝐆 𝐒𝐈𝐆𝐍𝐀𝐋𝐒
👇👇👇👇👇
t.me/Technical_Trader79
👇👇👇👇👇
t.me/Technical_Trader79
3/5 𝐃𝐀𝐈𝐋𝐘 𝐅𝐎𝐑𝐄𝐗 𝐂𝐑𝐘𝐏𝐓𝐎 𝐓𝐑𝐀𝐃𝐈𝐍𝐆 𝐒𝐈𝐆𝐍𝐀𝐋𝐒
👇👇👇👇👇
t.me/Technical_Trader79
Haftungsausschluss
Die Informationen und Veröffentlichungen sind nicht als Finanz-, Anlage-, Handels- oder andere Arten von Ratschlägen oder Empfehlungen gedacht, die von TradingView bereitgestellt oder gebilligt werden, und stellen diese nicht dar. Lesen Sie mehr in den Nutzungsbedingungen.