
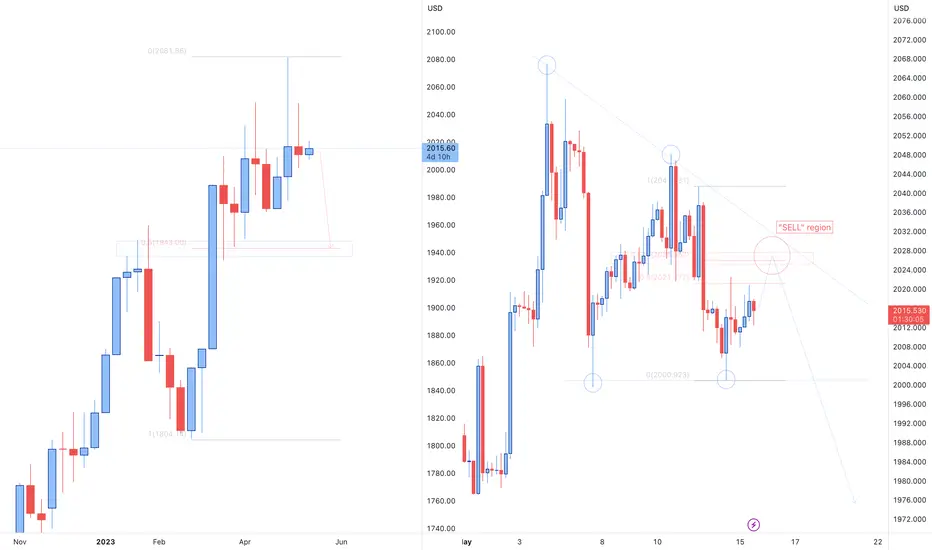
As thoroughly demonstrated in the publication made on Gold last week, deriving from the Weekly-timeframe graph (on the left-hand side of the screen), we are anticipating for the price to pull back into the crucial region of support lining up with the 50% Fibonacci retracement level as highlighted on the chart. Zooming into the H4 TF and adding up to the confluences, we might infer that the price has formed a descending triangle pattern and might touch the zone pictured on the graphic (the upper boundary of the triangle) once again before initiating a full-scale drop as planned.

Verbundene Veröffentlichungen
Haftungsausschluss
Die Informationen und Veröffentlichungen sind nicht als Finanz-, Anlage-, Handels- oder andere Arten von Ratschlägen oder Empfehlungen gedacht, die von TradingView bereitgestellt oder gebilligt werden, und stellen diese nicht dar. Lesen Sie mehr in den Nutzungsbedingungen.
Verbundene Veröffentlichungen
Haftungsausschluss
Die Informationen und Veröffentlichungen sind nicht als Finanz-, Anlage-, Handels- oder andere Arten von Ratschlägen oder Empfehlungen gedacht, die von TradingView bereitgestellt oder gebilligt werden, und stellen diese nicht dar. Lesen Sie mehr in den Nutzungsbedingungen.