
XAUUSD – Gold Pulls Back, But The Weekly Recovery Is Not Over Yet
Gold is pulling back after a strong rejection from the recent high.
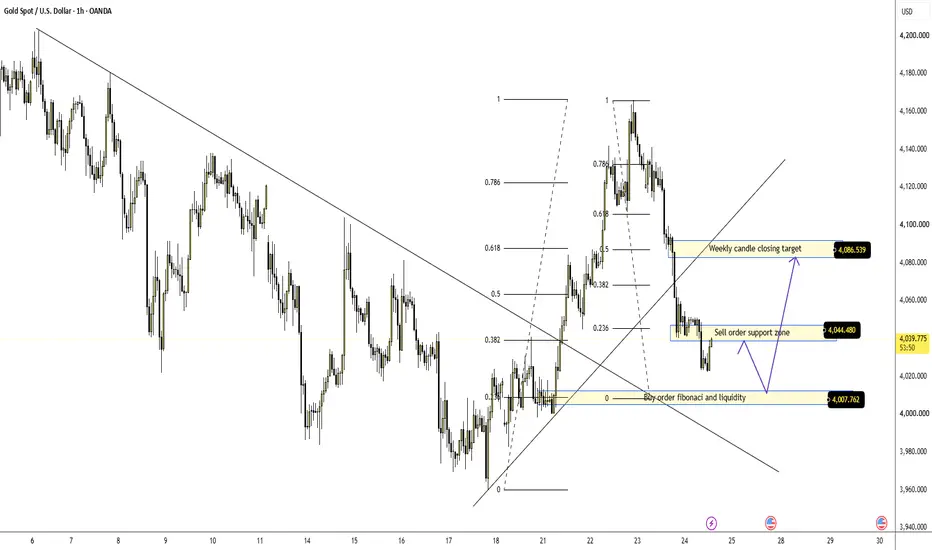
Price is currently trading around 4,038 after losing momentum from the upper area near 4,160. Sellers have clearly regained short-term control, and the chart is now testing whether this decline is only a correction or the start of a deeper bearish continuation.
The important point is simple: gold is still above the key buy order Fibonacci zone around 4,007. As long as this area holds, buyers still have a chance to defend the weekly recovery.
FUNDAMENTAL ANALYSIS
Gold is trading softer after dropping from its near two-week high, while the U.S. dollar also remains under pressure due to tariff concerns and profit-taking.
However, sellers have regained short-term control after the recent bearish breakdown signal, and weaker RSI on the daily chart shows that momentum has cooled.
Even with the pullback, gold is still on track for its first weekly gain after three weeks of losses. This makes today’s closing area very important.
TECHNICAL ANALYSIS – SMC + FIBONACCI
From an SMC perspective, gold has reacted strongly from the upper zone and created a clear downside move. The market broke below the short-term rising structure, showing that buyers lost control after the recent recovery.
The current sell order support zone around 4,044 is now acting as the first resistance. If price fails to reclaim this level, sellers may continue to pressure gold lower.
Below price, the key area is the buy order Fibonacci and liquidity zone around 4,007. This is the main decision zone on the chart. If buyers defend this level, gold may create a recovery back toward 4,044 and possibly the weekly candle closing target around 4,086.
The 4,086 area is important because it represents the weekly closing target and short-term recovery resistance. A clean move back above 4,044 would make this target more realistic.
But if gold breaks below 4,007 with strong momentum, the weekly recovery weakens and sellers may continue pushing price toward lower liquidity.
KEY PRICE ZONES
Current price: 4,038
Sell order support zone: 4,044
Buy order Fibonacci / liquidity zone: 4,007
Weekly candle closing target: 4,086
Short-term resistance: 4,044 – 4,086
Lower support if 4,007 fails: 3,980 – 3,960
Bullish recovery valid: Above 4,007
Bearish pressure remains: Below 4,044
Invalidation for recovery view: Below 4,007
TRADING SCENARIOS
Buy Scenario
Buy Zone: 4,007
Entry: Bullish reaction, liquidity sweep, or lower-timeframe CHoCH from the buy order Fibonacci zone
SL: Below 4,007 or below the nearest swing low
TP1: 4,044
TP2: 4,086
Breakout Buy
Condition: Break and hold above 4,044
Target: 4,086
Sell Scenario
Sell Zone: 4,044
Entry: Bearish rejection, failed reclaim, or lower-timeframe bearish CHoCH
SL: Above 4,086
TP1: 4,007
TP2: 3,980 – 3,960
Breakdown Sell
Condition: Clean break below 4,007
Target: 3,980 – 3,960
MY VIEW
Gold is under short-term selling pressure, but the weekly recovery is not fully broken yet.
The chart is now sitting between two important levels: 4,044 above and 4,007 below. If buyers defend 4,007, gold may still recover toward 4,086 before the weekly close. But if price rejects from 4,044 or breaks below 4,007, sellers may take control again.
For me, this is a decision-zone chart.
I do not want to chase the middle. I want to see whether gold can reclaim 4,044, or whether sellers push it back into the 4,007 liquidity zone.
Do you think gold will defend 4,007 and recover toward 4,086, or will sellers break the weekly support?
Gold is pulling back after a strong rejection from the recent high.
Price is currently trading around 4,038 after losing momentum from the upper area near 4,160. Sellers have clearly regained short-term control, and the chart is now testing whether this decline is only a correction or the start of a deeper bearish continuation.
The important point is simple: gold is still above the key buy order Fibonacci zone around 4,007. As long as this area holds, buyers still have a chance to defend the weekly recovery.
FUNDAMENTAL ANALYSIS
Gold is trading softer after dropping from its near two-week high, while the U.S. dollar also remains under pressure due to tariff concerns and profit-taking.
However, sellers have regained short-term control after the recent bearish breakdown signal, and weaker RSI on the daily chart shows that momentum has cooled.
Even with the pullback, gold is still on track for its first weekly gain after three weeks of losses. This makes today’s closing area very important.
TECHNICAL ANALYSIS – SMC + FIBONACCI
From an SMC perspective, gold has reacted strongly from the upper zone and created a clear downside move. The market broke below the short-term rising structure, showing that buyers lost control after the recent recovery.
The current sell order support zone around 4,044 is now acting as the first resistance. If price fails to reclaim this level, sellers may continue to pressure gold lower.
Below price, the key area is the buy order Fibonacci and liquidity zone around 4,007. This is the main decision zone on the chart. If buyers defend this level, gold may create a recovery back toward 4,044 and possibly the weekly candle closing target around 4,086.
The 4,086 area is important because it represents the weekly closing target and short-term recovery resistance. A clean move back above 4,044 would make this target more realistic.
But if gold breaks below 4,007 with strong momentum, the weekly recovery weakens and sellers may continue pushing price toward lower liquidity.
KEY PRICE ZONES
Current price: 4,038
Sell order support zone: 4,044
Buy order Fibonacci / liquidity zone: 4,007
Weekly candle closing target: 4,086
Short-term resistance: 4,044 – 4,086
Lower support if 4,007 fails: 3,980 – 3,960
Bullish recovery valid: Above 4,007
Bearish pressure remains: Below 4,044
Invalidation for recovery view: Below 4,007
TRADING SCENARIOS
Buy Scenario
Buy Zone: 4,007
Entry: Bullish reaction, liquidity sweep, or lower-timeframe CHoCH from the buy order Fibonacci zone
SL: Below 4,007 or below the nearest swing low
TP1: 4,044
TP2: 4,086
Breakout Buy
Condition: Break and hold above 4,044
Target: 4,086
Sell Scenario
Sell Zone: 4,044
Entry: Bearish rejection, failed reclaim, or lower-timeframe bearish CHoCH
SL: Above 4,086
TP1: 4,007
TP2: 3,980 – 3,960
Breakdown Sell
Condition: Clean break below 4,007
Target: 3,980 – 3,960
MY VIEW
Gold is under short-term selling pressure, but the weekly recovery is not fully broken yet.
The chart is now sitting between two important levels: 4,044 above and 4,007 below. If buyers defend 4,007, gold may still recover toward 4,086 before the weekly close. But if price rejects from 4,044 or breaks below 4,007, sellers may take control again.
For me, this is a decision-zone chart.
I do not want to chase the middle. I want to see whether gold can reclaim 4,044, or whether sellers push it back into the 4,007 liquidity zone.
Do you think gold will defend 4,007 and recover toward 4,086, or will sellers break the weekly support?

Trading is a journey. The destination is mastering yourself
t.me/+qqEvv7Li9Tg2NTE1
t.me/+qqEvv7Li9Tg2NTE1
Verbundene Veröffentlichungen
Haftungsausschluss
Die Informationen und Veröffentlichungen sind nicht als Finanz-, Anlage-, Handels- oder andere Arten von Ratschlägen oder Empfehlungen gedacht, die von TradingView bereitgestellt oder gebilligt werden, und stellen diese nicht dar. Lesen Sie mehr in den Nutzungsbedingungen.
Trading is a journey. The destination is mastering yourself
t.me/+qqEvv7Li9Tg2NTE1
t.me/+qqEvv7Li9Tg2NTE1
Verbundene Veröffentlichungen
Haftungsausschluss
Die Informationen und Veröffentlichungen sind nicht als Finanz-, Anlage-, Handels- oder andere Arten von Ratschlägen oder Empfehlungen gedacht, die von TradingView bereitgestellt oder gebilligt werden, und stellen diese nicht dar. Lesen Sie mehr in den Nutzungsbedingungen.