
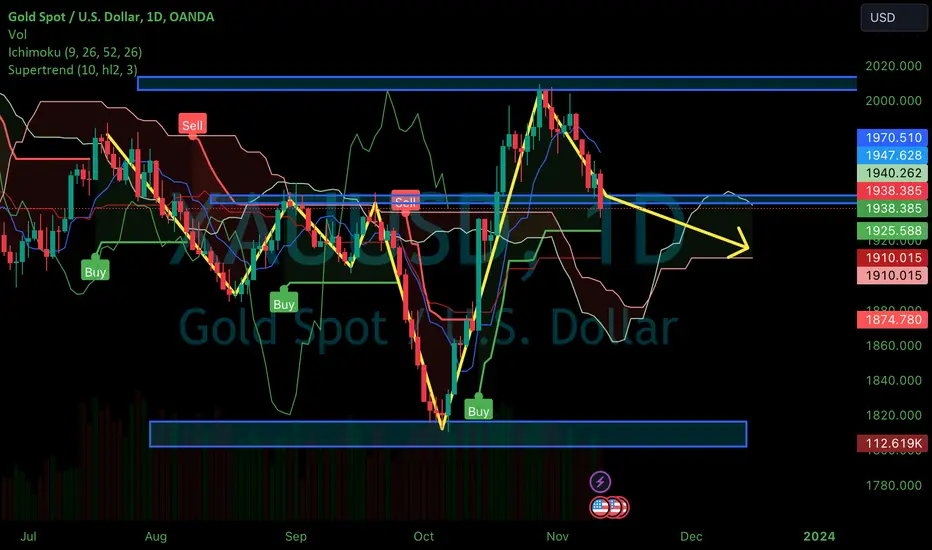
Gold maintains its downward trend, trading at a new 4-week low around $1,940 USD despite a weak U.S. dollar. The metal is set to end the week with a notable decrease. The daily XAU/USD chart shows bullish attempts to surpass the 23.6% Fibonacci retracement level at $1,962.20 but forms lower highs and lows below the 20-day Simple Moving Average (SMA). Technical indicators exhibit mild bullish signals in neutral territory.
On the 4-hour chart, XAU/USD faces sellers near the declining 20-day SMA, dragging its average below the flat 100-day SMA. Breaking above these indicators could encourage buyers for higher intraday profits. Technical indicators point north within negative territory.
Support levels: $1,945.20, $1,933.20, $1,923.10
Resistance levels: $1,965.30, $1,978.30, $1,989.00
On the 4-hour chart, XAU/USD faces sellers near the declining 20-day SMA, dragging its average below the flat 100-day SMA. Breaking above these indicators could encourage buyers for higher intraday profits. Technical indicators point north within negative territory.
Support levels: $1,945.20, $1,933.20, $1,923.10
Resistance levels: $1,965.30, $1,978.30, $1,989.00
Trade ist aktiv

Haftungsausschluss
Die Informationen und Veröffentlichungen sind nicht als Finanz-, Anlage-, Handels- oder andere Arten von Ratschlägen oder Empfehlungen gedacht, die von TradingView bereitgestellt oder gebilligt werden, und stellen diese nicht dar. Lesen Sie mehr in den Nutzungsbedingungen.
Haftungsausschluss
Die Informationen und Veröffentlichungen sind nicht als Finanz-, Anlage-, Handels- oder andere Arten von Ratschlägen oder Empfehlungen gedacht, die von TradingView bereitgestellt oder gebilligt werden, und stellen diese nicht dar. Lesen Sie mehr in den Nutzungsbedingungen.