
XAUUSD / GOLD SELL SETUP EXPLANATION
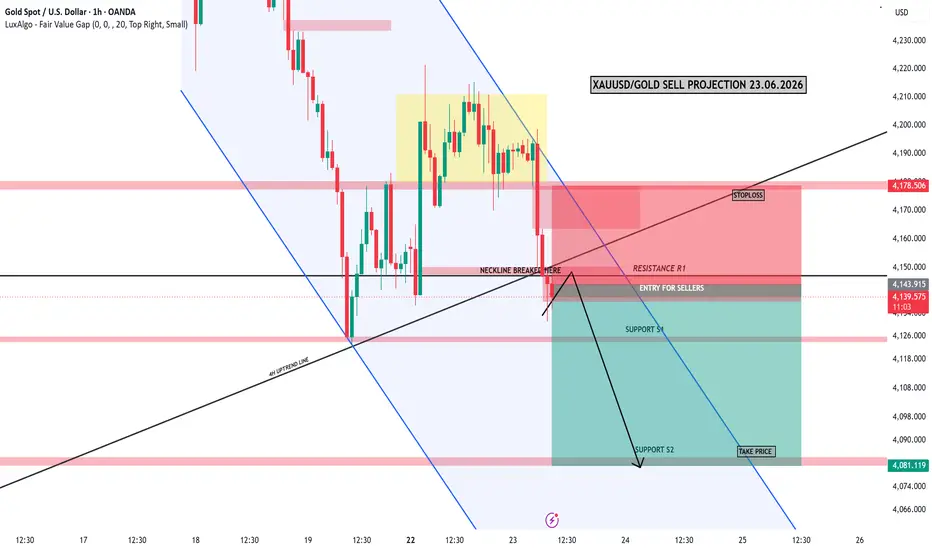
This chart suggests a bearish (sell) outlook for Gold based on a trendline break and a neckline breakdown.
1. Market Structure
Gold was previously moving in an uptrend.
The 4H Uptrend Line has been broken.
Price also broke below the Neckline support level.
This indicates a potential shift from a bullish trend to a bearish trend.
2. Sell Entry Zone
Entry for Sellers: Around 4138 – 4144
Why?
After a strong breakdown, price often retraces back to the broken support (now acting as resistance).
Traders look for sell opportunities in this retracement zone.
3. Stop Loss Area
Stop Loss: Around 4178
Reason:
If price moves back above the resistance zone and closes strongly above it, the bearish setup becomes invalid.
Therefore, the stop loss is placed above the resistance area.
4. Target Levels
Target 1 (Support S1)
4125 – 4128
This is the nearest support zone where price may temporarily pause or bounce.
Target 2 (Support S2)
4081 – 4085
This is the major downside target shown in the chart.
5. Trade Logic
The setup is based on:
✅ Trendline Break
✅ Neckline Break
✅ Resistance Retest
✅ Bearish Market Structure
Trading Plan
Sell Zone: 4138 – 4144
Stop Loss: 4178
Take Profit 1: 4128
Take Profit 2: 4081
This chart suggests a bearish (sell) outlook for Gold based on a trendline break and a neckline breakdown.
1. Market Structure
Gold was previously moving in an uptrend.
The 4H Uptrend Line has been broken.
Price also broke below the Neckline support level.
This indicates a potential shift from a bullish trend to a bearish trend.
2. Sell Entry Zone
Entry for Sellers: Around 4138 – 4144
Why?
After a strong breakdown, price often retraces back to the broken support (now acting as resistance).
Traders look for sell opportunities in this retracement zone.
3. Stop Loss Area
Stop Loss: Around 4178
Reason:
If price moves back above the resistance zone and closes strongly above it, the bearish setup becomes invalid.
Therefore, the stop loss is placed above the resistance area.
4. Target Levels
Target 1 (Support S1)
4125 – 4128
This is the nearest support zone where price may temporarily pause or bounce.
Target 2 (Support S2)
4081 – 4085
This is the major downside target shown in the chart.
5. Trade Logic
The setup is based on:
✅ Trendline Break
✅ Neckline Break
✅ Resistance Retest
✅ Bearish Market Structure
Trading Plan
Sell Zone: 4138 – 4144
Stop Loss: 4178
Take Profit 1: 4128
Take Profit 2: 4081

Haftungsausschluss
Die Informationen und Veröffentlichungen sind nicht als Finanz-, Anlage-, Handels- oder andere Arten von Ratschlägen oder Empfehlungen gedacht, die von TradingView bereitgestellt oder gebilligt werden, und stellen diese nicht dar. Lesen Sie mehr in den Nutzungsbedingungen.
Haftungsausschluss
Die Informationen und Veröffentlichungen sind nicht als Finanz-, Anlage-, Handels- oder andere Arten von Ratschlägen oder Empfehlungen gedacht, die von TradingView bereitgestellt oder gebilligt werden, und stellen diese nicht dar. Lesen Sie mehr in den Nutzungsbedingungen.