
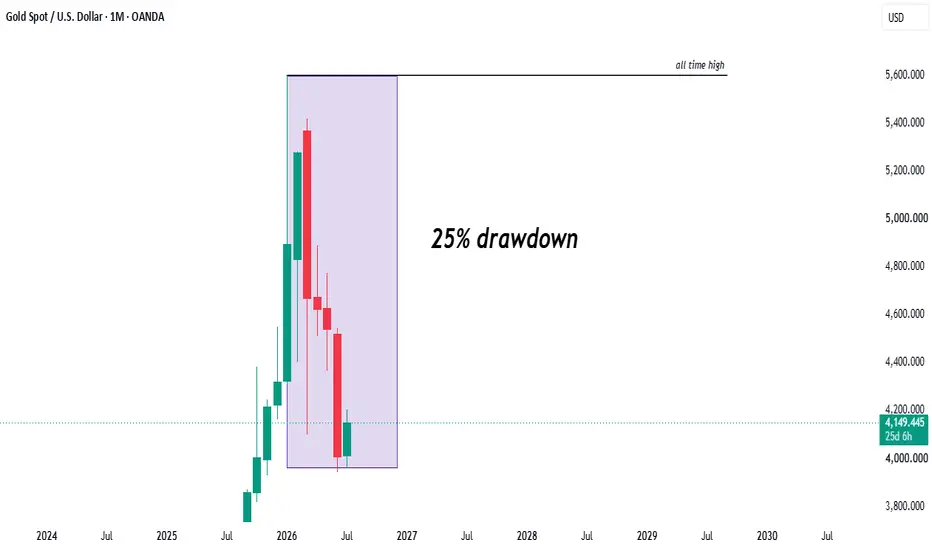
Gold has corrected roughly ~23–25% from its early-2026 record high, marking one of the more meaningful pullbacks within the current expansion phase.
The move has been widely framed as momentum exhaustion.
But the structure of the decline points to something more specific: a liquidity-driven repricing within financial positioning, occurring alongside continued structural accumulation from the official sector.
Price action vs flow structure: a split regime
On the price side, gold transitioned from a record high into a sharp corrective phase after an extended trend environment.
The move coincided with a familiar macro mix:
Repricing of interest rate expectations
Periodic USD strength during risk rebalancing
Profit-taking after extended trend extension
This combination tends to matter more for gold than most commodities because of its sensitivity to real yields and opportunity cost.
On the flow side, official-sector demand has remained comparatively stable.
Estimates consolidated through the World Gold Council indicate:
Central banks purchased ~863 tonnes in 2025
This remains materially above long-run historical averages
Net buying is estimated to have remained positive into early 2026 (~Q1 prints still elevated versus prior cycles)
The key divergence is not direction, but sensitivity:
Price is reacting to financial flows.
Official-sector demand is operating on a multi-year allocation horizon.
Central bank demand: structural, not cyclical chasing
Central bank activity continues to reflect reserve diversification rather than tactical positioning.
Even during record price conditions in 2025, official-sector accumulation remained net positive, with only intermittent moderation in pace rather than reversal.
Survey-based expectations compiled by the World Gold Council also continue to point toward:
Gradual increase in gold allocation targets
Rising preference for non-dollar reserve diversification
Multi-year continuation of accumulation behavior
Importantly, this does not imply price insensitivity.
It implies a different decision function: strategic reserve composition rather than short-term return optimization.
The correction mechanism: liquidity and positioning
The drawdown phase aligns closely with standard commodity cycle mechanics following trend exhaustion.
As price transitions from trend expansion into consolidation:
Trend-following exposure becomes stretched
ETF and futures positioning reaches elevated sensitivity
Volatility expansion triggers de-risking
Exit flows become self-reinforcing
This creates a feedback loop where price moves faster than underlying physical demand changes.
In this structure, liquidity is the transmission mechanism, not fundamentals.
Positioning dynamics: amplification, not causation
Modern gold pricing is heavily influenced by layered participation:
Systematic trend strategies (CTA-style exposure)
ETF allocation flows
Futures leverage and margin sensitivity
These flows do not define the long-term direction of demand.
They define the path dependency of price.
Once momentum slows, the same structure that amplified the upside tends to amplify the downside through de-risking rather than accumulation.
Macro anchor: real yields remain the dominant variable
Despite flow complexity, gold remains anchored to a simple macro relationship:
Higher real yields → headwind
Lower real yields → tailwind
USD strength → short-term pressure
USD weakness → structural support
Recent conditions reflect intermittent tightening in financial conditions and shifting expectations around the rate path, which tends to compress non-yielding assets during transition phases.
Structural divergence: two-layer gold market
The current environment continues to reflect a dual-layer structure:
1. Financial layer (price-driven)
Cyclical
Highly responsive to liquidity and positioning
Drives short- to medium-term volatility
2. Official sector layer (reserve-driven)
Structural
Multi-year horizon
Driven by diversification and reserve strategy
This divergence explains why sharp drawdowns can occur without a corresponding collapse in long-term demand conditions.
Interpretation
This phase is best characterized as:
A liquidity-driven drawdown within a broader structural accumulation regime.
Not a breakdown in demand.
Not a reversal in central bank behavior.
Not a regime shift in gold’s reserve role.
Price is adjusting to positioning.
The underlying reserve structure remains intact.
Conclusion
Gold’s ~25% correction reflects a familiar post-ATH market sequence:
Trend expansion into record highs
Liquidity thinning at the top
Positioning unwind as momentum fades
Macro repricing through rates and USD dynamics
However, official-sector behavior, as reflected in aggregated estimates from the World Gold Council, continues to indicate structurally elevated accumulation relative to long-term history.
The market is therefore not experiencing demand loss.
It is experiencing a redistribution of ownership between financial participants and official-sector holders with price acting as the adjustment mechanism between the two.
put together by : Pako Phutietsile as currencynerd
The move has been widely framed as momentum exhaustion.
But the structure of the decline points to something more specific: a liquidity-driven repricing within financial positioning, occurring alongside continued structural accumulation from the official sector.
Price action vs flow structure: a split regime
On the price side, gold transitioned from a record high into a sharp corrective phase after an extended trend environment.
The move coincided with a familiar macro mix:
Repricing of interest rate expectations
Periodic USD strength during risk rebalancing
Profit-taking after extended trend extension
This combination tends to matter more for gold than most commodities because of its sensitivity to real yields and opportunity cost.
On the flow side, official-sector demand has remained comparatively stable.
Estimates consolidated through the World Gold Council indicate:
Central banks purchased ~863 tonnes in 2025
This remains materially above long-run historical averages
Net buying is estimated to have remained positive into early 2026 (~Q1 prints still elevated versus prior cycles)
The key divergence is not direction, but sensitivity:
Price is reacting to financial flows.
Official-sector demand is operating on a multi-year allocation horizon.
Central bank demand: structural, not cyclical chasing
Central bank activity continues to reflect reserve diversification rather than tactical positioning.
Even during record price conditions in 2025, official-sector accumulation remained net positive, with only intermittent moderation in pace rather than reversal.
Survey-based expectations compiled by the World Gold Council also continue to point toward:
Gradual increase in gold allocation targets
Rising preference for non-dollar reserve diversification
Multi-year continuation of accumulation behavior
Importantly, this does not imply price insensitivity.
It implies a different decision function: strategic reserve composition rather than short-term return optimization.
The correction mechanism: liquidity and positioning
The drawdown phase aligns closely with standard commodity cycle mechanics following trend exhaustion.
As price transitions from trend expansion into consolidation:
Trend-following exposure becomes stretched
ETF and futures positioning reaches elevated sensitivity
Volatility expansion triggers de-risking
Exit flows become self-reinforcing
This creates a feedback loop where price moves faster than underlying physical demand changes.
In this structure, liquidity is the transmission mechanism, not fundamentals.
Positioning dynamics: amplification, not causation
Modern gold pricing is heavily influenced by layered participation:
Systematic trend strategies (CTA-style exposure)
ETF allocation flows
Futures leverage and margin sensitivity
These flows do not define the long-term direction of demand.
They define the path dependency of price.
Once momentum slows, the same structure that amplified the upside tends to amplify the downside through de-risking rather than accumulation.
Macro anchor: real yields remain the dominant variable
Despite flow complexity, gold remains anchored to a simple macro relationship:
Higher real yields → headwind
Lower real yields → tailwind
USD strength → short-term pressure
USD weakness → structural support
Recent conditions reflect intermittent tightening in financial conditions and shifting expectations around the rate path, which tends to compress non-yielding assets during transition phases.
Structural divergence: two-layer gold market
The current environment continues to reflect a dual-layer structure:
1. Financial layer (price-driven)
Cyclical
Highly responsive to liquidity and positioning
Drives short- to medium-term volatility
2. Official sector layer (reserve-driven)
Structural
Multi-year horizon
Driven by diversification and reserve strategy
This divergence explains why sharp drawdowns can occur without a corresponding collapse in long-term demand conditions.
Interpretation
This phase is best characterized as:
A liquidity-driven drawdown within a broader structural accumulation regime.
Not a breakdown in demand.
Not a reversal in central bank behavior.
Not a regime shift in gold’s reserve role.
Price is adjusting to positioning.
The underlying reserve structure remains intact.
Conclusion
Gold’s ~25% correction reflects a familiar post-ATH market sequence:
Trend expansion into record highs
Liquidity thinning at the top
Positioning unwind as momentum fades
Macro repricing through rates and USD dynamics
However, official-sector behavior, as reflected in aggregated estimates from the World Gold Council, continues to indicate structurally elevated accumulation relative to long-term history.
The market is therefore not experiencing demand loss.
It is experiencing a redistribution of ownership between financial participants and official-sector holders with price acting as the adjustment mechanism between the two.
put together by : Pako Phutietsile as currencynerd

Verbundene Veröffentlichungen
Haftungsausschluss
Die Informationen und Veröffentlichungen sind nicht als Finanz-, Anlage-, Handels- oder andere Arten von Ratschlägen oder Empfehlungen gedacht, die von TradingView bereitgestellt oder gebilligt werden, und stellen diese nicht dar. Lesen Sie mehr in den Nutzungsbedingungen.
Verbundene Veröffentlichungen
Haftungsausschluss
Die Informationen und Veröffentlichungen sind nicht als Finanz-, Anlage-, Handels- oder andere Arten von Ratschlägen oder Empfehlungen gedacht, die von TradingView bereitgestellt oder gebilligt werden, und stellen diese nicht dar. Lesen Sie mehr in den Nutzungsbedingungen.