
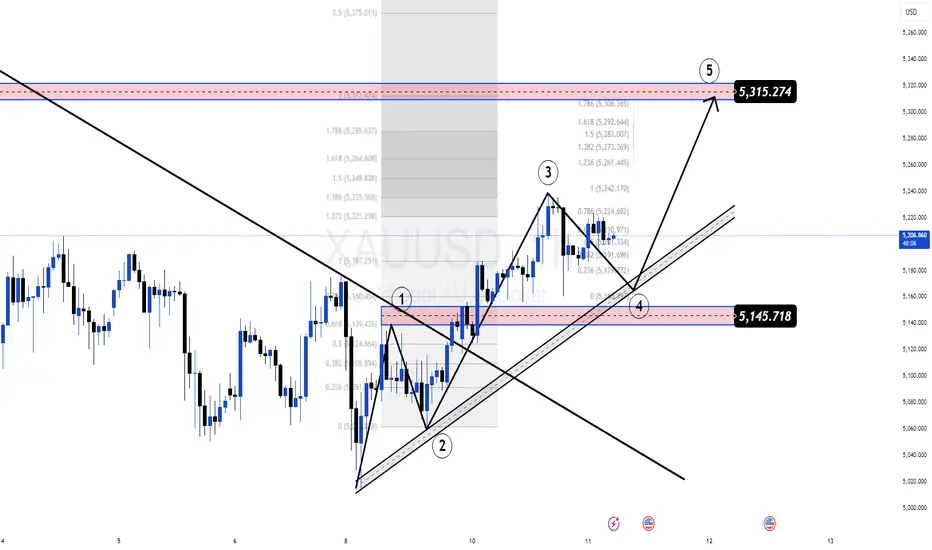
After the strong sell-off earlier, gold is gradually regaining momentum as the market starts forming a sequence of higher lows and higher highs. One key development is that price has broken above the long descending trendline, suggesting the market may be transitioning from consolidation into a short-term recovery phase.
The big question now:
Is this just a technical rebound, or the beginning of a larger bullish expansion?
Gold remains highly sensitive to macro drivers such as USD strength, interest rate expectations, and safe-haven demand. When price begins to shift into a structured ascending channel, it often signals that liquidity is rotating back into the market and momentum could begin expanding.
On the H1 timeframe, price is currently moving inside an ascending channel, while forming a clear impulsive structure:
1 → Initial structure break
2 → Pullback forming a higher low
3 → Bullish expansion move
4 → Demand zone retest
5 → Potential continuation toward higher liquidity
The key demand area currently sits around:
5145
As long as price holds above this level, the bullish structure remains intact.
Key Levels
Demand / Support
• 5145
Intraday structure level
• 5200
Major liquidity target
• 5315
IF–THEN Scenarios
📈 Bullish Scenario
If price continues holding above 5145 and respects the ascending channel structure, gold may continue its expansion toward higher liquidity zones:
• 5250
• 5315
📉 Bearish Scenario
However, if price breaks below 5145, the higher-low structure would fail and the market could rotate back toward lower equilibrium levels before determining the next directional move.
The big question now:
Is this just a technical rebound, or the beginning of a larger bullish expansion?
Gold remains highly sensitive to macro drivers such as USD strength, interest rate expectations, and safe-haven demand. When price begins to shift into a structured ascending channel, it often signals that liquidity is rotating back into the market and momentum could begin expanding.
On the H1 timeframe, price is currently moving inside an ascending channel, while forming a clear impulsive structure:
1 → Initial structure break
2 → Pullback forming a higher low
3 → Bullish expansion move
4 → Demand zone retest
5 → Potential continuation toward higher liquidity
The key demand area currently sits around:
5145
As long as price holds above this level, the bullish structure remains intact.
Key Levels
Demand / Support
• 5145
Intraday structure level
• 5200
Major liquidity target
• 5315
IF–THEN Scenarios
📈 Bullish Scenario
If price continues holding above 5145 and respects the ascending channel structure, gold may continue its expansion toward higher liquidity zones:
• 5250
• 5315
📉 Bearish Scenario
However, if price breaks below 5145, the higher-low structure would fail and the market could rotate back toward lower equilibrium levels before determining the next directional move.

⚜️Trade with Money Market Flow, logic, Price action
🔥Live Market Updates-Realtime Trading Plans & Signal
t.me/+sBwjxIJbdoFmNjk1
⚜️Risk Reward 1.3 to 2.5...
⚜️Daily 8 to 16 Signals VIP
MMFLOW gives you precision entries & BIGWIN profits
🔥Live Market Updates-Realtime Trading Plans & Signal
t.me/+sBwjxIJbdoFmNjk1
⚜️Risk Reward 1.3 to 2.5...
⚜️Daily 8 to 16 Signals VIP
MMFLOW gives you precision entries & BIGWIN profits
Haftungsausschluss
Die Informationen und Veröffentlichungen sind nicht als Finanz-, Anlage-, Handels- oder andere Arten von Ratschlägen oder Empfehlungen gedacht, die von TradingView bereitgestellt oder gebilligt werden, und stellen diese nicht dar. Lesen Sie mehr in den Nutzungsbedingungen.
⚜️Trade with Money Market Flow, logic, Price action
🔥Live Market Updates-Realtime Trading Plans & Signal
t.me/+sBwjxIJbdoFmNjk1
⚜️Risk Reward 1.3 to 2.5...
⚜️Daily 8 to 16 Signals VIP
MMFLOW gives you precision entries & BIGWIN profits
🔥Live Market Updates-Realtime Trading Plans & Signal
t.me/+sBwjxIJbdoFmNjk1
⚜️Risk Reward 1.3 to 2.5...
⚜️Daily 8 to 16 Signals VIP
MMFLOW gives you precision entries & BIGWIN profits
Haftungsausschluss
Die Informationen und Veröffentlichungen sind nicht als Finanz-, Anlage-, Handels- oder andere Arten von Ratschlägen oder Empfehlungen gedacht, die von TradingView bereitgestellt oder gebilligt werden, und stellen diese nicht dar. Lesen Sie mehr in den Nutzungsbedingungen.