
Most traders spend a lot of time searching for confirmation.
They wait for moving average crosses, RSI signals or MACD turns while overlooking the one thing every indicator is ultimately derived from in the first place: price.
Unlike traditional indicators, price has no lag. The moment market conditions change, price reflects it immediately. That's why market structure can be one of the fastest ways to assess the current state of a market.
The objective isn't to predict the future. The objective is to understand who is currently in control and where that control is likely to be challenged next.
Think Balance and Imbalance
Many traders view market structure as little more than support and resistance.
In reality, market structure is the ongoing movement between balance and imbalance.
A market in balance is one where buyers and sellers are relatively matched. Price consolidates, rotates and searches for direction.
A market in imbalance is one where one side gains control and price begins moving aggressively away from fair value.
This process repeats continuously and, importantly, it repeats across all timeframes.
A daily chart can be in a strong uptrend while the four-hour chart is pulling back. A four-hour chart can be trending while the hourly chart consolidates.
Understanding where the market sits within that cycle can provide valuable context before you even begin looking for a trade.
Start One Timeframe Higher
One of the simplest ways to use market structure is to analyse one timeframe above the one you normally trade.
If you trade the hourly chart, start with the four-hour chart.
If you trade the daily chart, start with the weekly chart.
Your objective is to answer two questions:
• Is the market currently in balance or imbalance?
• Where are the key inflection points?
These inflection points are the swing highs and swing lows that define the current structure. They represent areas where buyers and sellers previously battled for control and often provide valuable clues about where attention should be focused next.
Once you've answered those questions, you can return to your trading timeframe and begin looking for opportunities that align with the bigger picture.
Gold Example
Let's assume you trade Gold using the hourly chart.
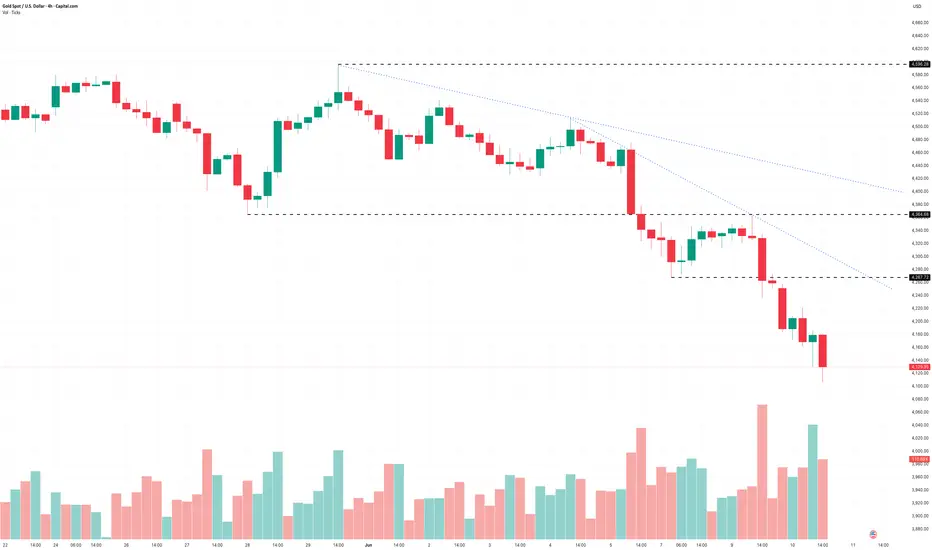
Before looking for an entry, you want to understand the higher timeframe market state. To do that, move up to the four-hour chart and identify the major swing highs and swing lows.
Gold (XAU/USD) Four-Hour Candle Chart

Past performance is not a reliable indicator of future results
Immediately, a few observations stand out.
The market has transitioned from balance into imbalance. A major support area has been broken, lower highs continue to form and sellers remain in control of the broader structure.
Just as importantly, the chart highlights several key inflection points where control previously shifted between buyers and sellers.
At this stage, you’re not looking for a trade. You’re simply building a market narrative.
The higher timeframe tells me sellers currently have the upper hand and that any opportunities on your execution timeframe should be viewed through that lens.
You can now return to the hourly chart.
Gold (XAU/USD) Hourly Candle Chart

Past performance is not a reliable indicator of future results
Notice how the previously broken support area on the four-hour chart now becomes an area of interest on the hourly chart.
Rather than randomly searching for opportunities, you have a specific zone to pay attention to price behaviour.
If buyers can reclaim the level and hold above it, the higher timeframe narrative may need revisiting.
If sellers defend the area and price begins rolling over again, the hourly chart is simply aligning with the existing four-hour imbalance.
The market structure hasn't generated a trade. It has narrowed your focus and provided context before you start making decisions.
Key Takeaways
Before looking for an entry, start by understanding the higher timeframe market state.
Move up one timeframe and ask yourself:
• Is the market currently in balance or imbalance?
• Where are the key inflection points?
• Who is currently in control?
Only then return to your trading timeframe and begin looking for opportunities.
Indicators can help refine execution, but market structure often provides the context those decisions are built upon.
Disclaimer: This is for information and learning purposes only. The information provided does not constitute investment advice nor take into account the individual financial circumstances or objectives of any investor. Any information that may be provided relating to past performance is not a reliable indicator of future results or performance. Social media channels are not relevant for UK residents.
Spread bets and CFDs are complex instruments and come with a high risk of losing money rapidly due to leverage. 78.48% of retail investor accounts lose money when trading spread bets and CFDs with this provider. You should consider whether you understand how spread bets and CFDs work and whether you can afford to take the high risk of losing your money.
They wait for moving average crosses, RSI signals or MACD turns while overlooking the one thing every indicator is ultimately derived from in the first place: price.
Unlike traditional indicators, price has no lag. The moment market conditions change, price reflects it immediately. That's why market structure can be one of the fastest ways to assess the current state of a market.
The objective isn't to predict the future. The objective is to understand who is currently in control and where that control is likely to be challenged next.
Think Balance and Imbalance
Many traders view market structure as little more than support and resistance.
In reality, market structure is the ongoing movement between balance and imbalance.
A market in balance is one where buyers and sellers are relatively matched. Price consolidates, rotates and searches for direction.
A market in imbalance is one where one side gains control and price begins moving aggressively away from fair value.
This process repeats continuously and, importantly, it repeats across all timeframes.
A daily chart can be in a strong uptrend while the four-hour chart is pulling back. A four-hour chart can be trending while the hourly chart consolidates.
Understanding where the market sits within that cycle can provide valuable context before you even begin looking for a trade.
Start One Timeframe Higher
One of the simplest ways to use market structure is to analyse one timeframe above the one you normally trade.
If you trade the hourly chart, start with the four-hour chart.
If you trade the daily chart, start with the weekly chart.
Your objective is to answer two questions:
• Is the market currently in balance or imbalance?
• Where are the key inflection points?
These inflection points are the swing highs and swing lows that define the current structure. They represent areas where buyers and sellers previously battled for control and often provide valuable clues about where attention should be focused next.
Once you've answered those questions, you can return to your trading timeframe and begin looking for opportunities that align with the bigger picture.
Gold Example
Let's assume you trade Gold using the hourly chart.
Before looking for an entry, you want to understand the higher timeframe market state. To do that, move up to the four-hour chart and identify the major swing highs and swing lows.
Gold (XAU/USD) Four-Hour Candle Chart
Past performance is not a reliable indicator of future results
Immediately, a few observations stand out.
The market has transitioned from balance into imbalance. A major support area has been broken, lower highs continue to form and sellers remain in control of the broader structure.
Just as importantly, the chart highlights several key inflection points where control previously shifted between buyers and sellers.
At this stage, you’re not looking for a trade. You’re simply building a market narrative.
The higher timeframe tells me sellers currently have the upper hand and that any opportunities on your execution timeframe should be viewed through that lens.
You can now return to the hourly chart.
Gold (XAU/USD) Hourly Candle Chart
Past performance is not a reliable indicator of future results
Notice how the previously broken support area on the four-hour chart now becomes an area of interest on the hourly chart.
Rather than randomly searching for opportunities, you have a specific zone to pay attention to price behaviour.
If buyers can reclaim the level and hold above it, the higher timeframe narrative may need revisiting.
If sellers defend the area and price begins rolling over again, the hourly chart is simply aligning with the existing four-hour imbalance.
The market structure hasn't generated a trade. It has narrowed your focus and provided context before you start making decisions.
Key Takeaways
Before looking for an entry, start by understanding the higher timeframe market state.
Move up one timeframe and ask yourself:
• Is the market currently in balance or imbalance?
• Where are the key inflection points?
• Who is currently in control?
Only then return to your trading timeframe and begin looking for opportunities.
Indicators can help refine execution, but market structure often provides the context those decisions are built upon.
Disclaimer: This is for information and learning purposes only. The information provided does not constitute investment advice nor take into account the individual financial circumstances or objectives of any investor. Any information that may be provided relating to past performance is not a reliable indicator of future results or performance. Social media channels are not relevant for UK residents.
Spread bets and CFDs are complex instruments and come with a high risk of losing money rapidly due to leverage. 78.48% of retail investor accounts lose money when trading spread bets and CFDs with this provider. You should consider whether you understand how spread bets and CFDs work and whether you can afford to take the high risk of losing your money.

Haftungsausschluss
Die Informationen und Veröffentlichungen sind nicht als Finanz-, Anlage-, Handels- oder andere Arten von Ratschlägen oder Empfehlungen gedacht, die von TradingView bereitgestellt oder gebilligt werden, und stellen diese nicht dar. Lesen Sie mehr in den Nutzungsbedingungen.
Haftungsausschluss
Die Informationen und Veröffentlichungen sind nicht als Finanz-, Anlage-, Handels- oder andere Arten von Ratschlägen oder Empfehlungen gedacht, die von TradingView bereitgestellt oder gebilligt werden, und stellen diese nicht dar. Lesen Sie mehr in den Nutzungsbedingungen.